15 Nov 2019
EUR/USD Technical Analysis: Euro corrects early November decline, ends the week above 1.1050 level
- EUR/USD ends the week near its highs as the market is correcting the recent November decline.
- The correction can continue to the 1.1055/78 resistance zone.
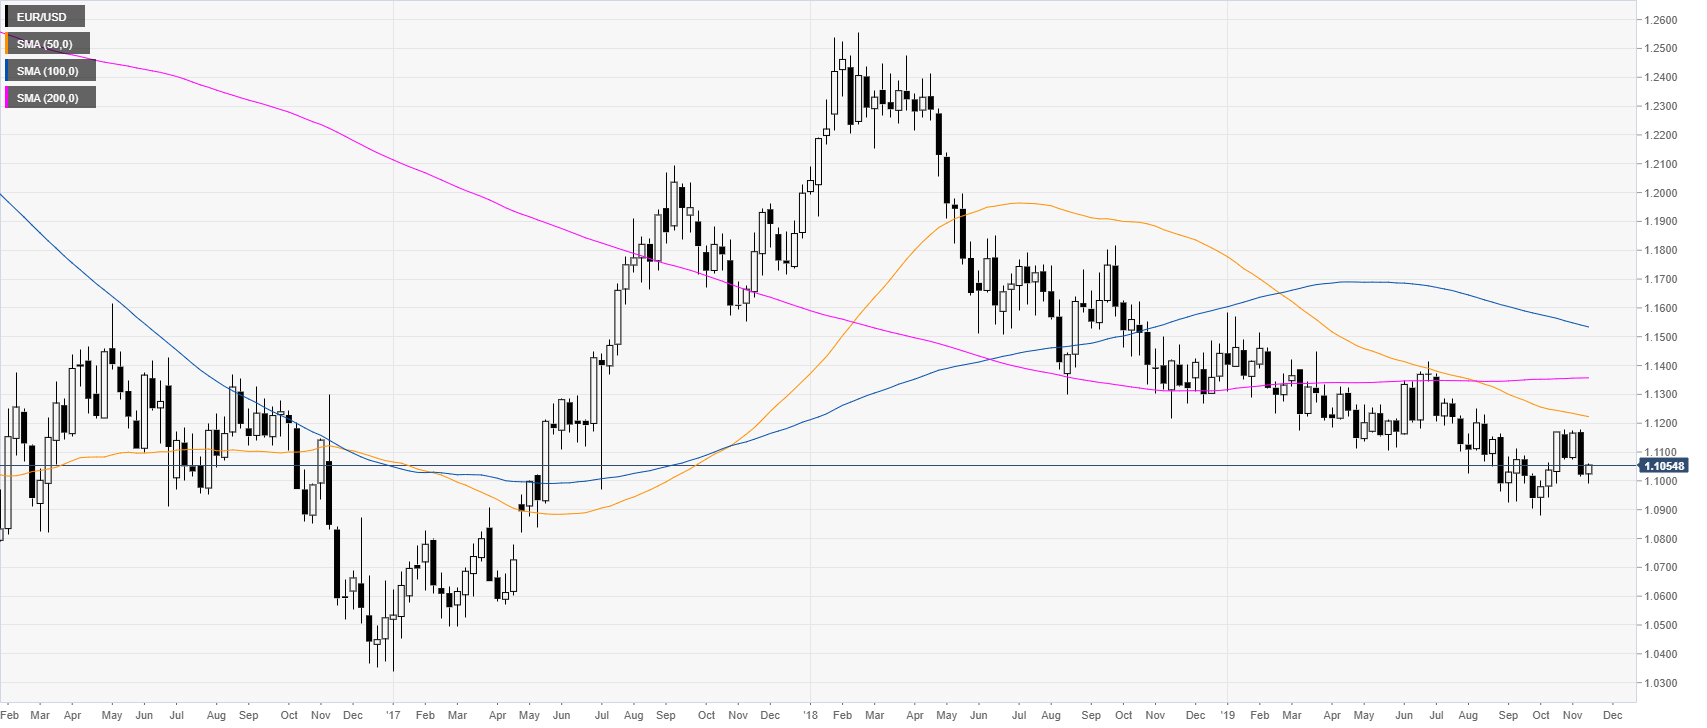
EUR/USD weekly chart
EUR/USD had a small corrective bounce above the 1.1000 handle this week. The market is trading below its main weekly simple moving averages in a weak bear trend.
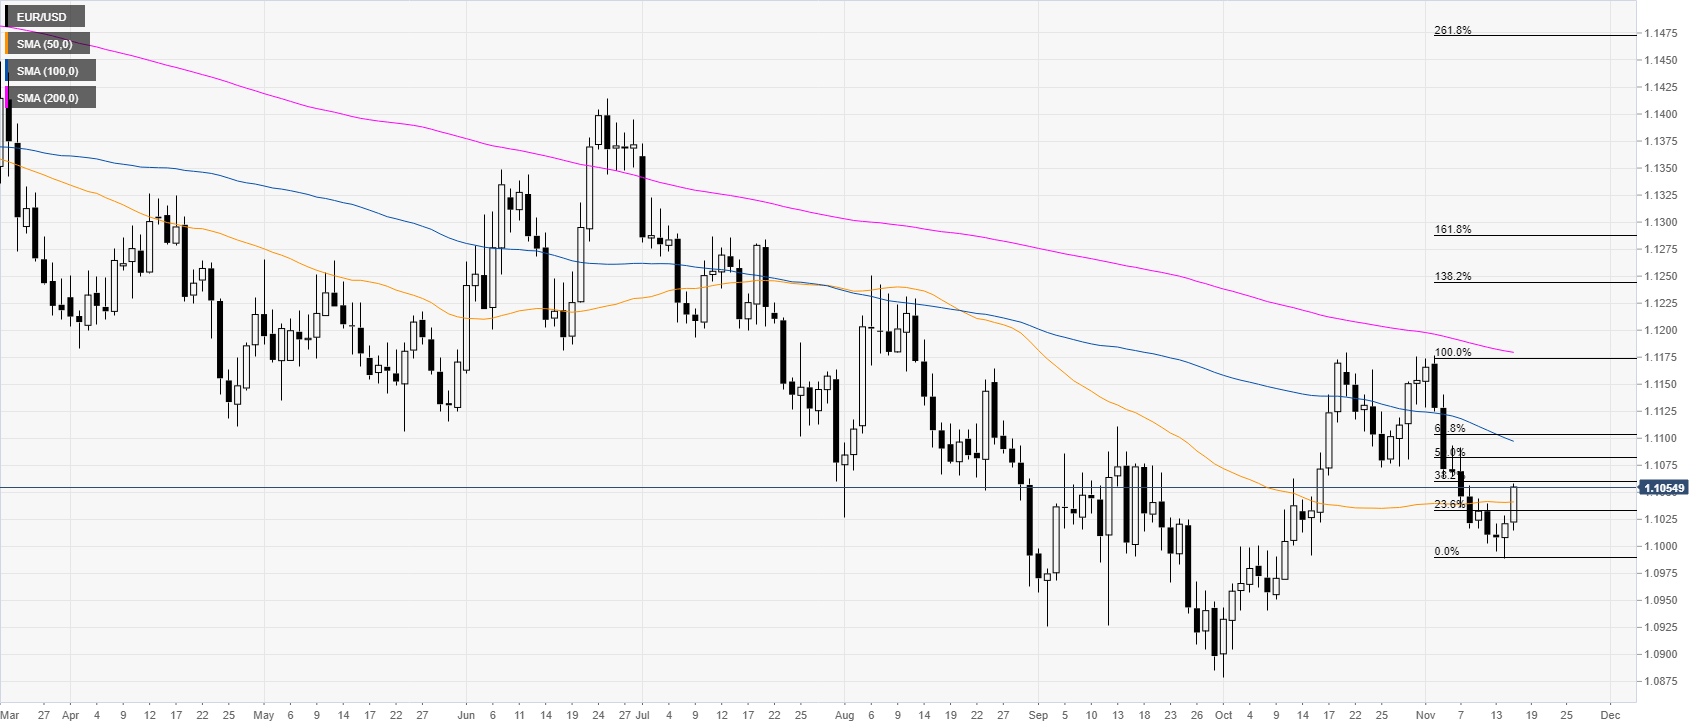
EUR/USD daily chart
The Euro, on the daily chart, is trading in a bear trend below downward sloping 100 and 200-day simple moving averages (DMAs). This Friday the market corrected to the upside and broke above the 50 DMA today at 1.1041. The spot also reached the 1.1060 level which is the 38.2 Fibonacci retracement from the current November decline.
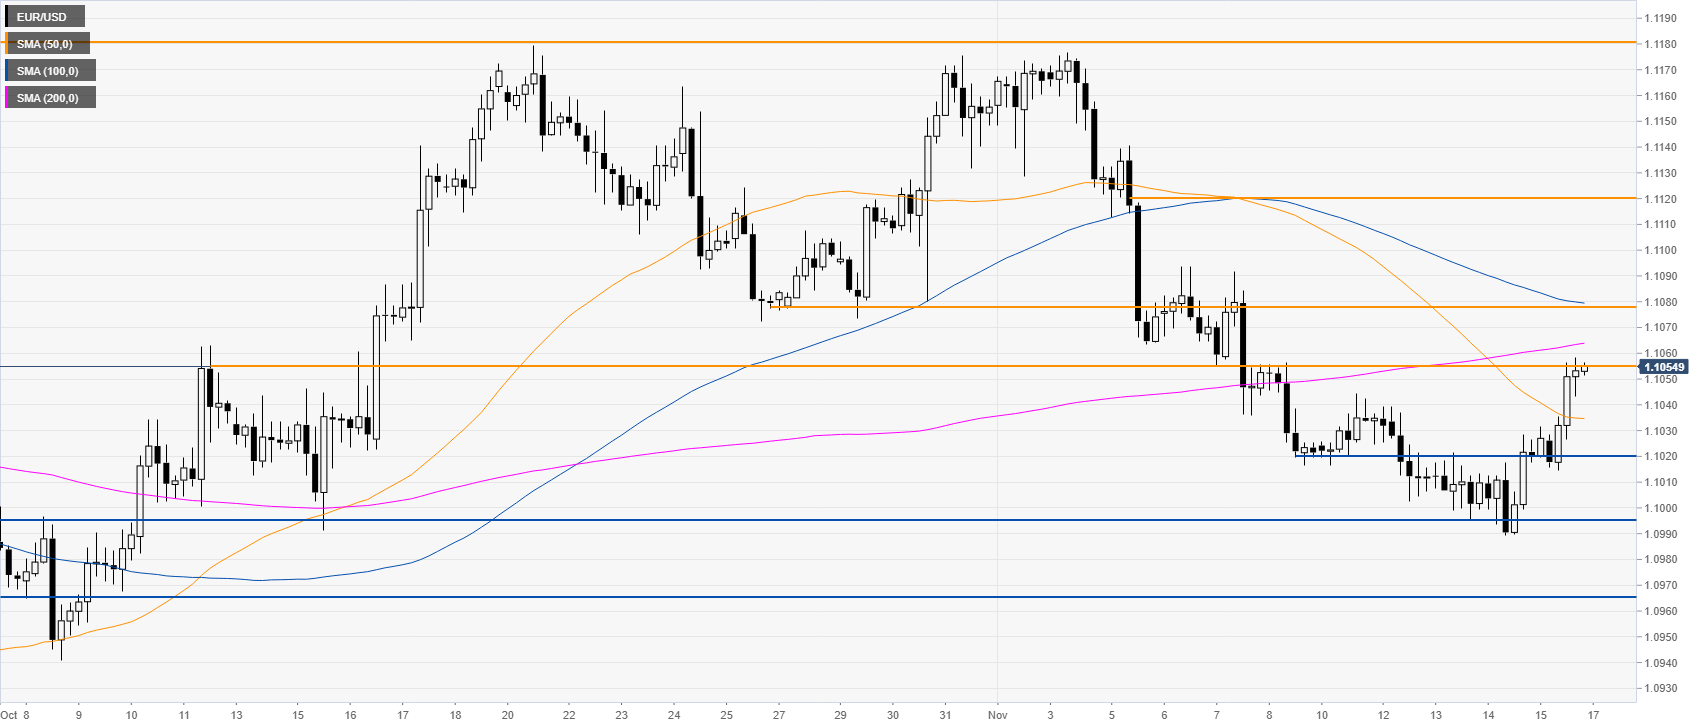
EUR/USD four-hour chart
The Fiber is correcting up as it moved beyond the 50 SMA. There is a weak resistance at 1.1055, which might be overcome, according to the Technical Confluences Indicator. Afterwards, comes the 1.1078 strong resistance near the 200 SMA. If that also fails to contain prices, then the market might continue its correction towards the 1.1112 level. Further up lie the 1.1181 resistance.
Additional key levels