USD/JPY Technical Analysis: Pullback from 61.8% Fibo. keeps 50/100-day EMA in focus
- USD/JPY fails to sustain bounces off 50% Fibonacci retracement.
- October low gains bears’ attention during the downside break.
The USD/JPY pair’s failure to stay strong beyond three-day highs drags it back to key support confluence as it trades near 108.60 during early Tuesday.
The pair now aims to re-test 50% Fibonacci retracement of April-August declines, at 108.40. However, a confluence of 50 and 100-day Exponential Moving Average (EMA) around 108.30/25 will be the key to limit the pair’s further downside.
In a case where prices close below 108.25, October month bottom surrounding 106.50 will be in the spotlight.
On the contrary, a daily closing beyond 61.8% Fibonacci retracement level of 109.36 opens the door for the quote’s extended run-up to 110.00 round-figure, near May 30 high, whereas May 21 top close to 110.70 could please buyers next.
If at all bulls manage to cross 110.70, early-April low near 110.85 could question bulls targeting the yearly top near 112.40.
USD/JPY daily chart
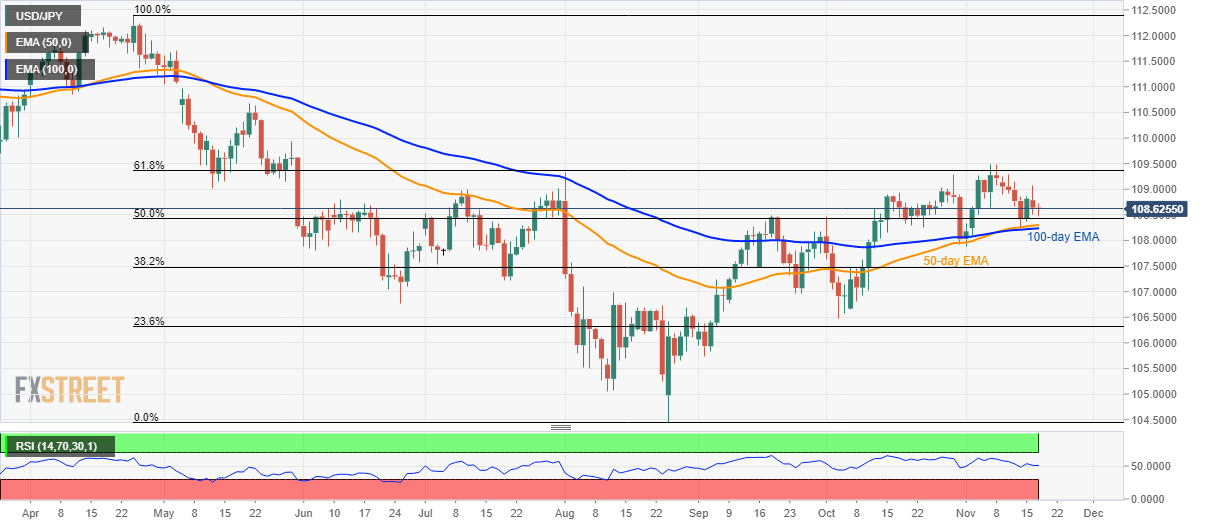
Trend: Bullish