Gold Price News & Forecast: XAU/USD looking to bottom out on the weekly chart
Gold looking to chart trough on weekly
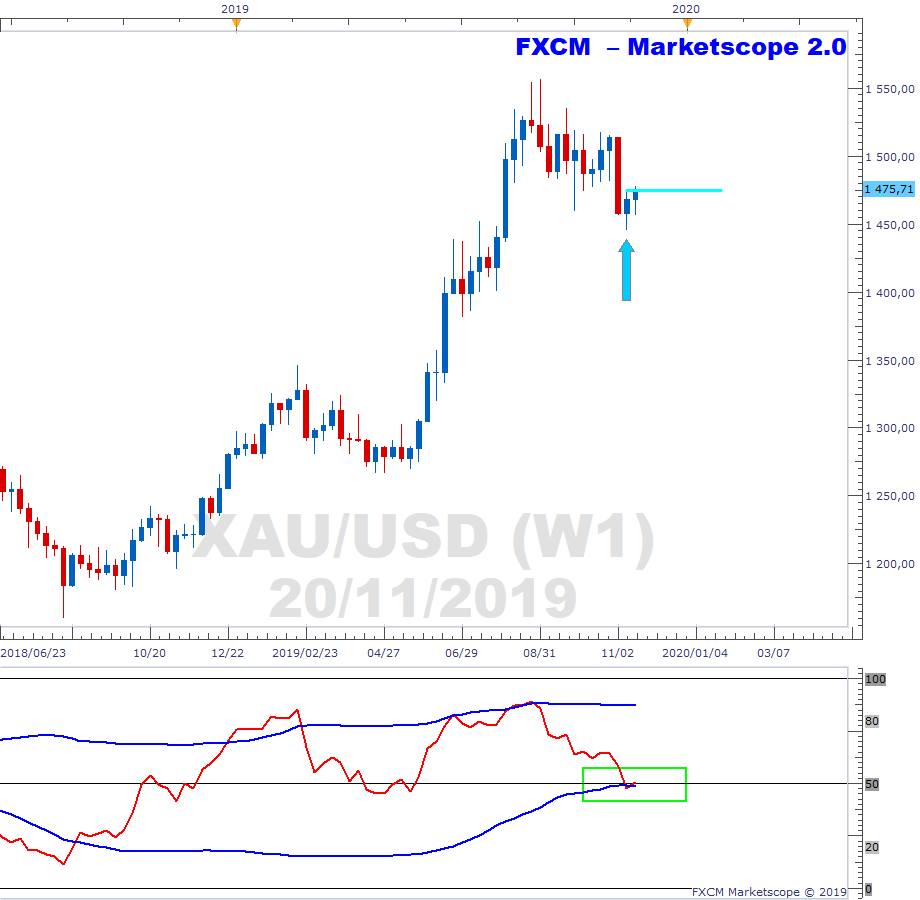
Below is the weekly chart of XAUUSD. Given the risk that markets are generally overbought, it is instructive to consider gold. One would imagine that as capital leaves the risk markets, and as their oscillators normalize, that it will find a new home in havens. To this end, gold may be charting a turning point.
We note that last week's candle may be a bullish reference candle i.e. a candle with the lowest low in at least a 3-candle cluster. Price this week has moved above last week’s high, but it will need to close above it to give real weight to the bullish reference candle scenario. On a relative level, the precious metal’s RSI was oversold and is now correcting (green rectangle). We continue to monitor. Read more...
Gold loses momentum ahead of $1,480 as the focus remains on trade, FOMC
XAU/USD extended its steady recovery that started last week and touched a fresh two-week high of $1,479 before losing its traction ahead of the American session. As of writing, the pair was trading at $1,473.50.
The lack of clarity on the US-Sino trade dispute has been weighing on the market sentiment since the start of the week and allowing safe-haven assets such as the precious metal find demand. Read more...