25 Nov 2019
AUD/USD Technical Analysis: Aussie under pressure challenging November lows, sub-0.6800 handle
- The aussie is starting the week on the back foot trading below the 0.6800 figure.
- The level to beat for bears is the 0.6773 support.
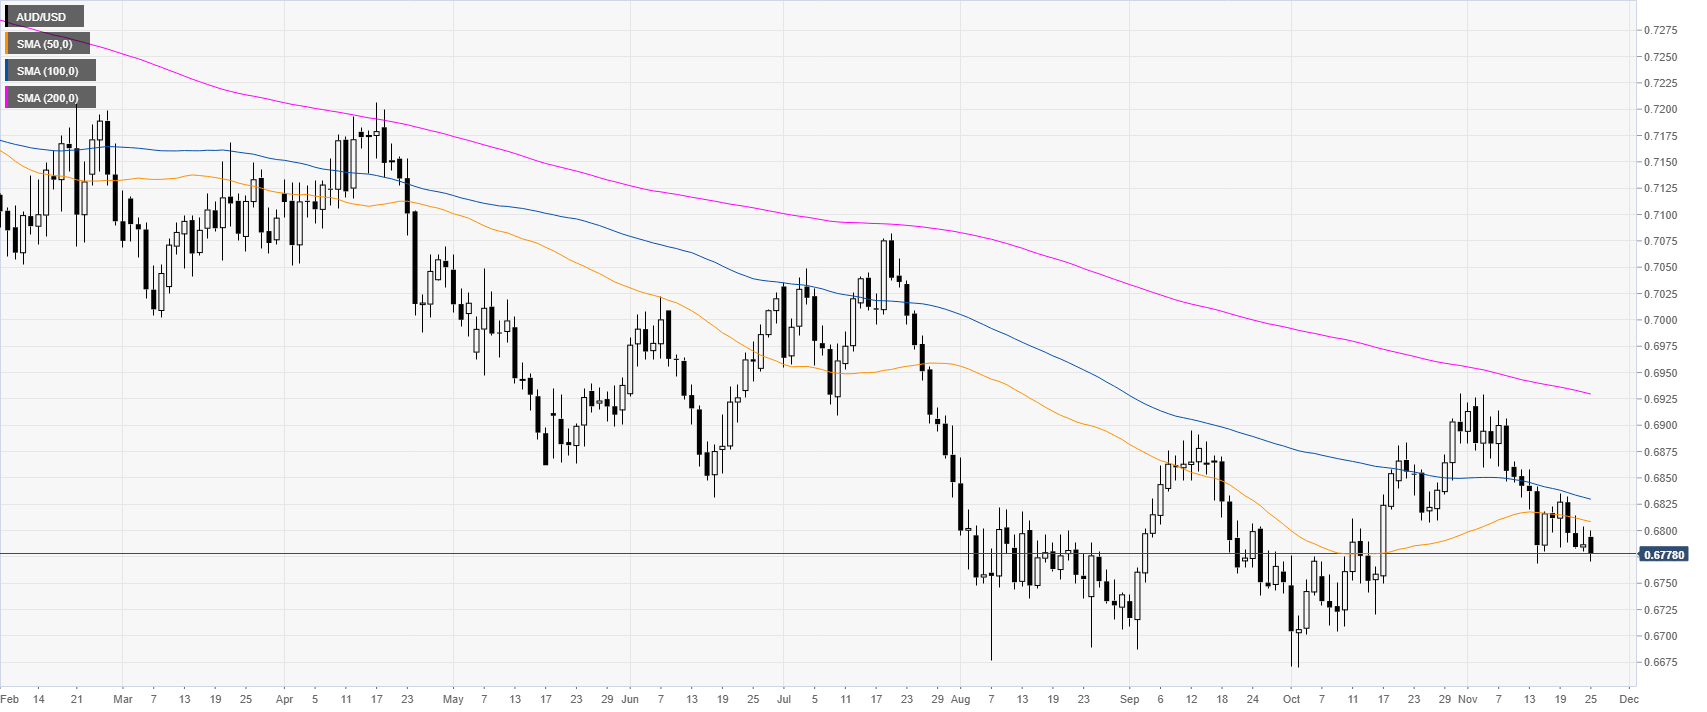
AUD/USD daily chart
The aussie is trading in a downtrend below the main daily simple moving averages (DMAs) on the daily time frame chart. The market is starting the week challenging last week’s lows below the 0.6800 handle.
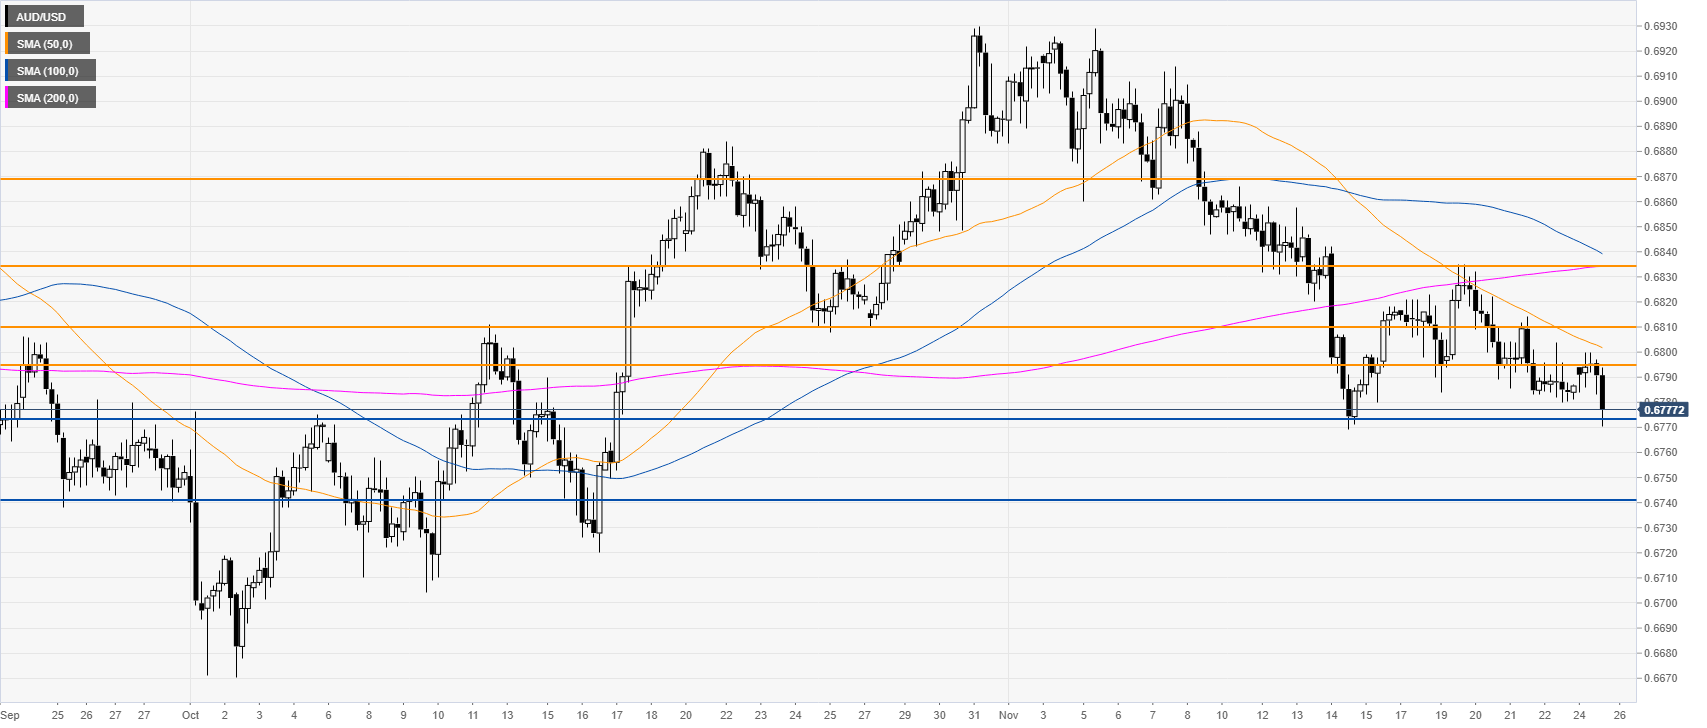
AUD/USD 4-hour chart
The spot is under heavy pressure below the main SMAs as it is battling with the November lows. As the market is challenging the 0.6773 (swing low), a break below it can lead to the 0.6740 level, according to the Technical Confluences Indicator.
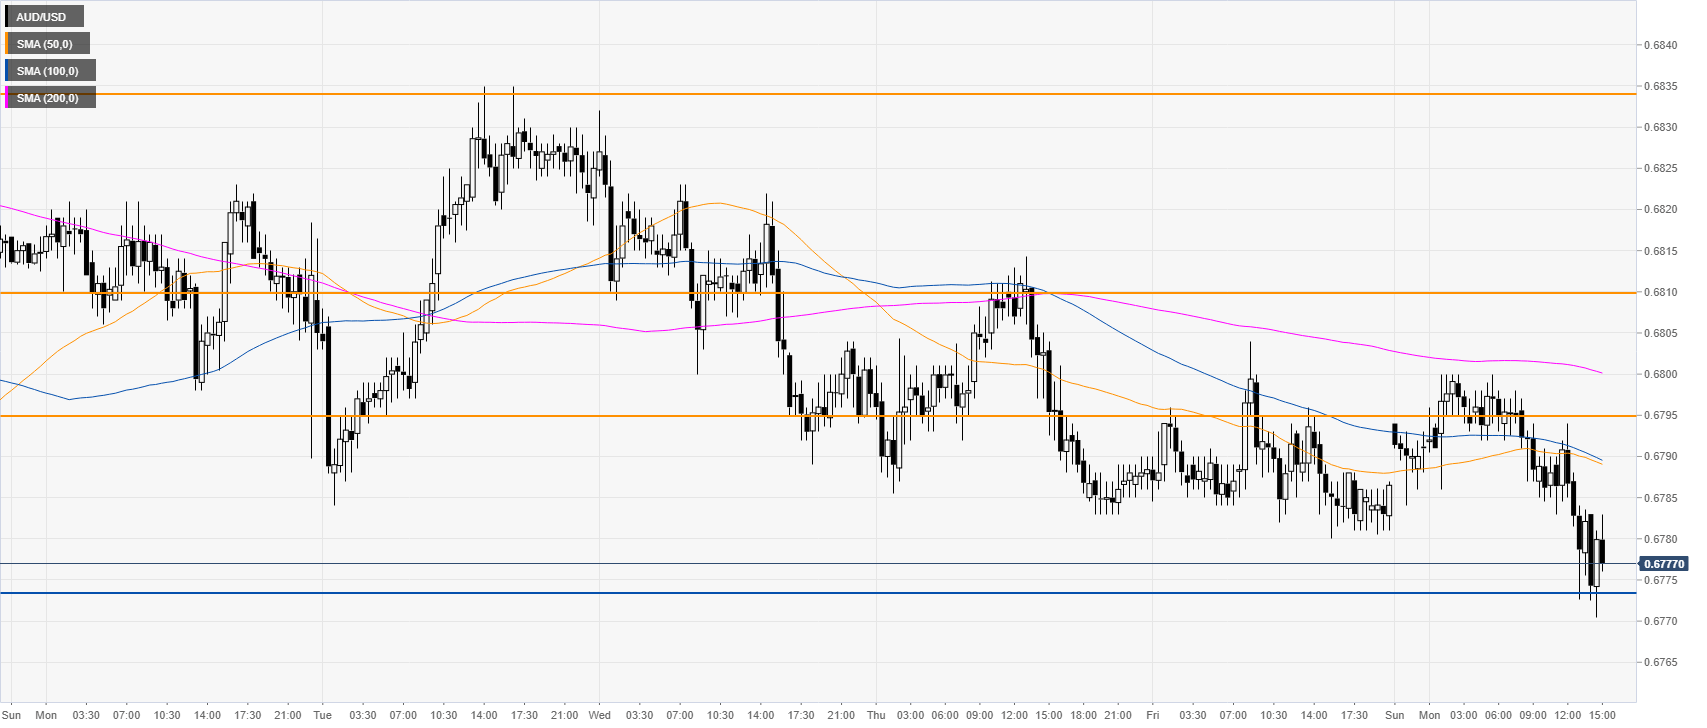
AUD/USD 30-minute chart
AUD/USD is trading below the main SMAs, suggesting a bearish bias in the short term. Resistances are seen at the 0.6795 and 0.6810 price levels, according to the Technical Confluences Indicator.
Additional key levels