25 Nov 2019
GBP/USD Technical Analysis: Cable easing from daily highs, trading back below the 1.2900 handle
- The cable is starting the week with a small recovery, which aimed at the 1.2900 handle.
- The level to beat for buyers is the 1.2900/1.2916 resistance zone.
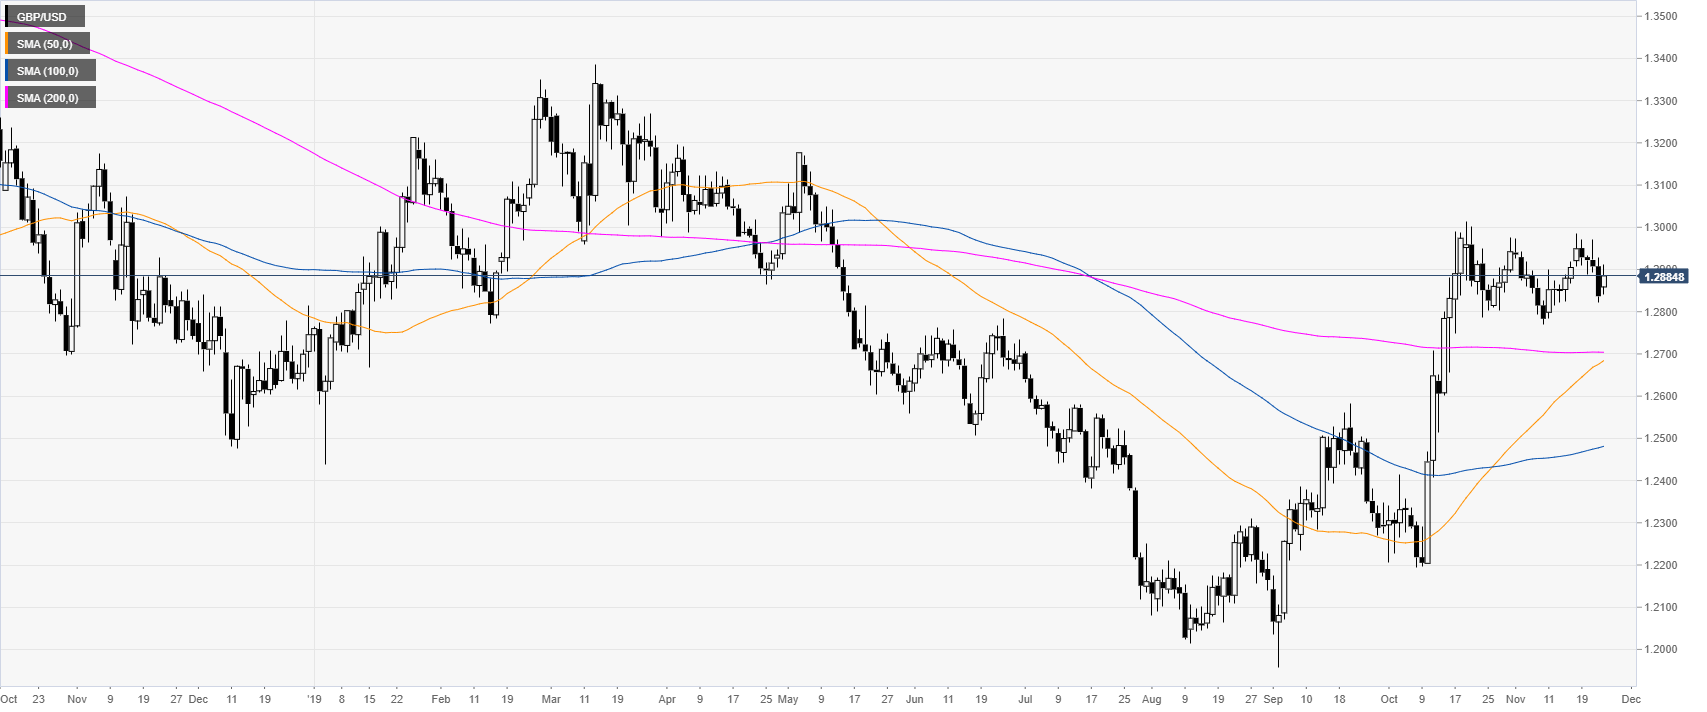
GBP/USD daily chart
GBP/USD is battling for the 1.2900 handle as the market is chopping in November. The market keeps an underlying bullish bias while trading above the main daily simple moving averages (DMAs).
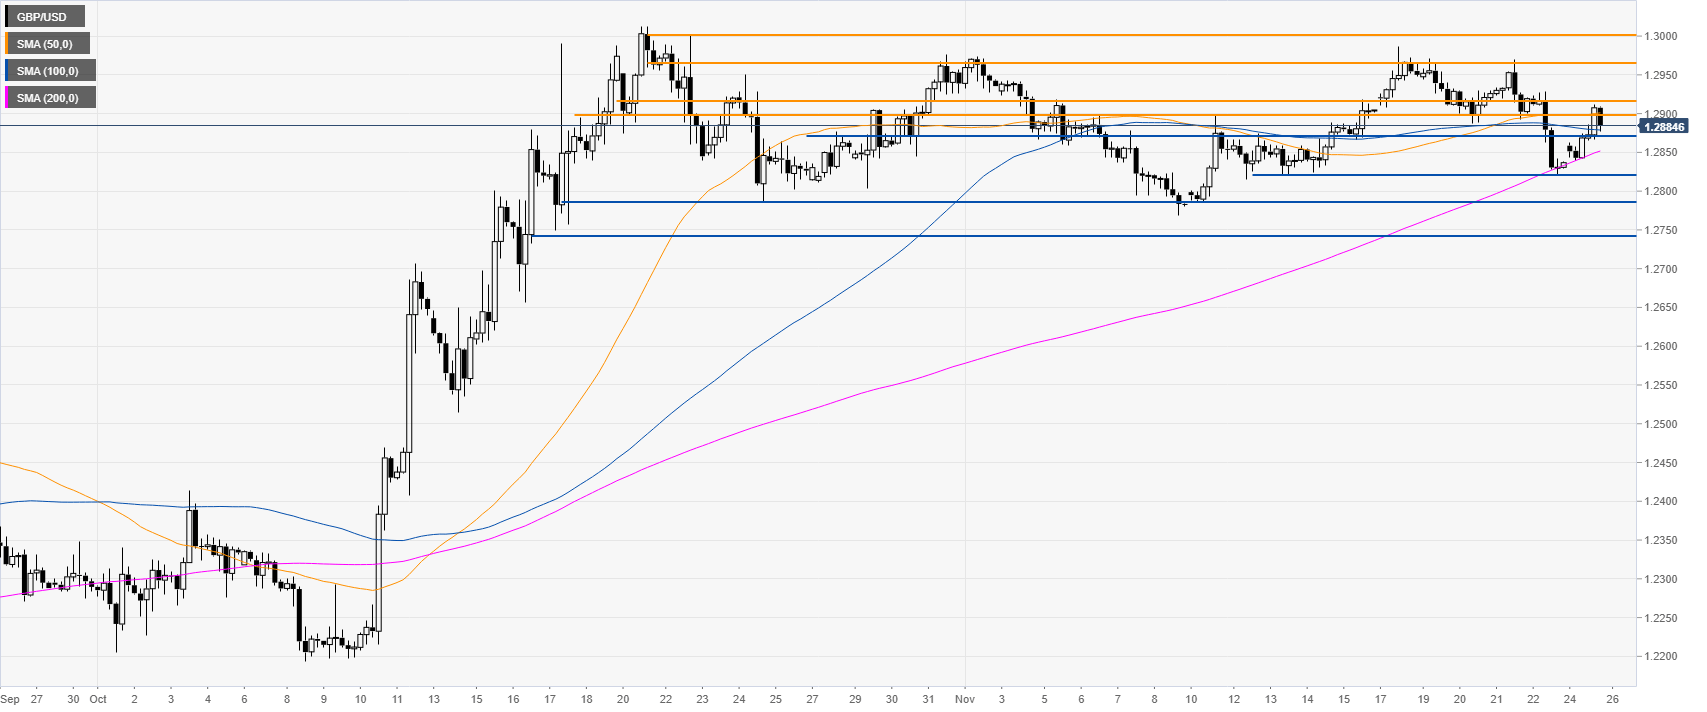
GBP/USD four-hour chart
The spot is trading above a rising 200 SMA, suggesting bullish momentum. A break above the 1.2900/1.2916 resistance zone is necessary to trigger further gains towards the 1.2964/1.3000 resistance zone, according to the Technical Confluences Indicator.
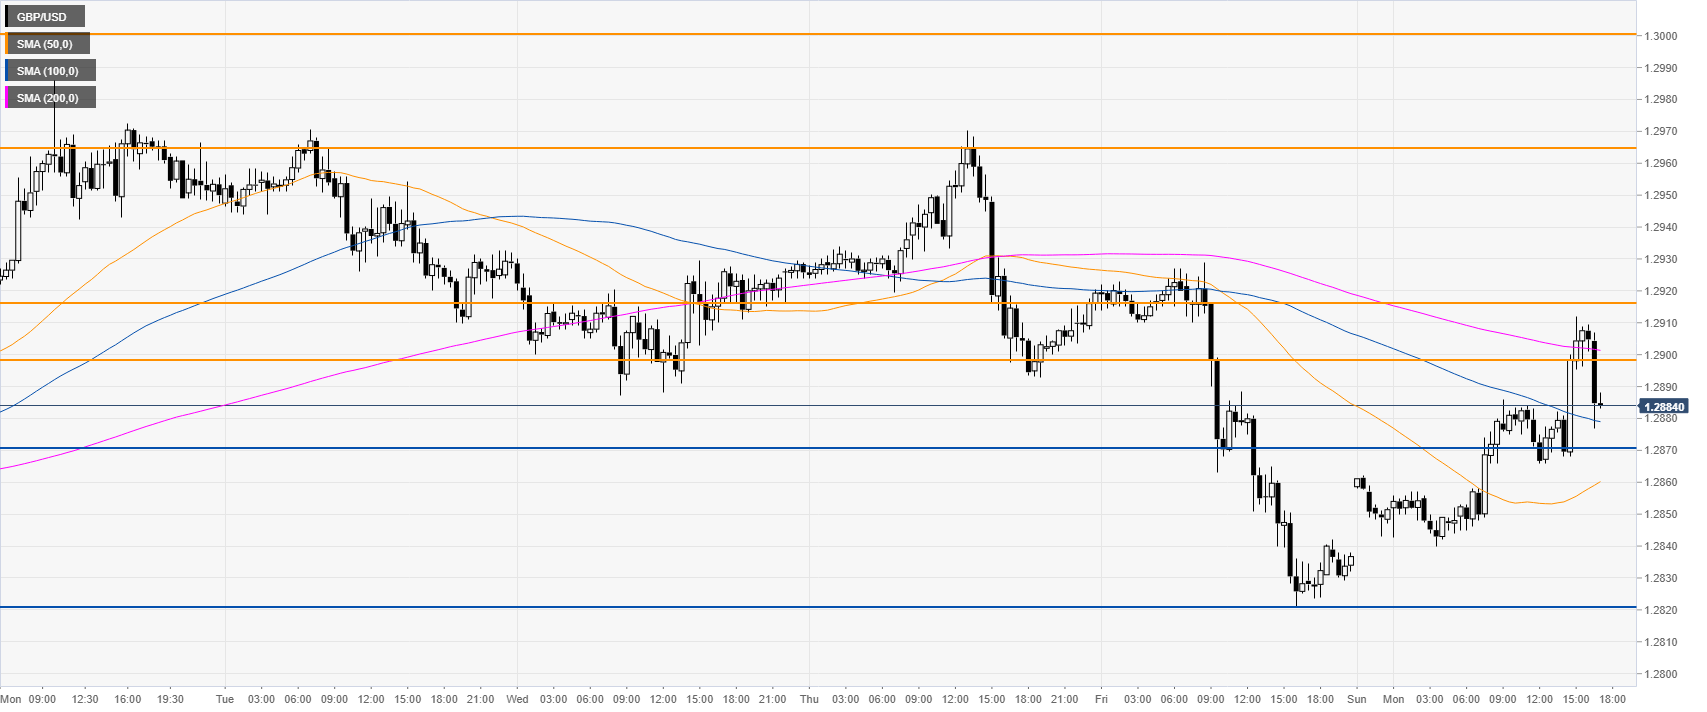
GBP/USD 30-minute chart
GBP/USD is starting the week with an attempt at regaining the 1.2900/1.2916 resistance zone. Bulls seem to be in control for the time being. Support is seen at the 1.2870 and 1.2820 price levels.
Additional key levels