3 Dec 2019
Oil Technical Analysis: WTI sidelined above $56.00 a barrel
- WTI remained choppy on the second day of the week.
- The level to beat for sellers is the 56.00 handle.
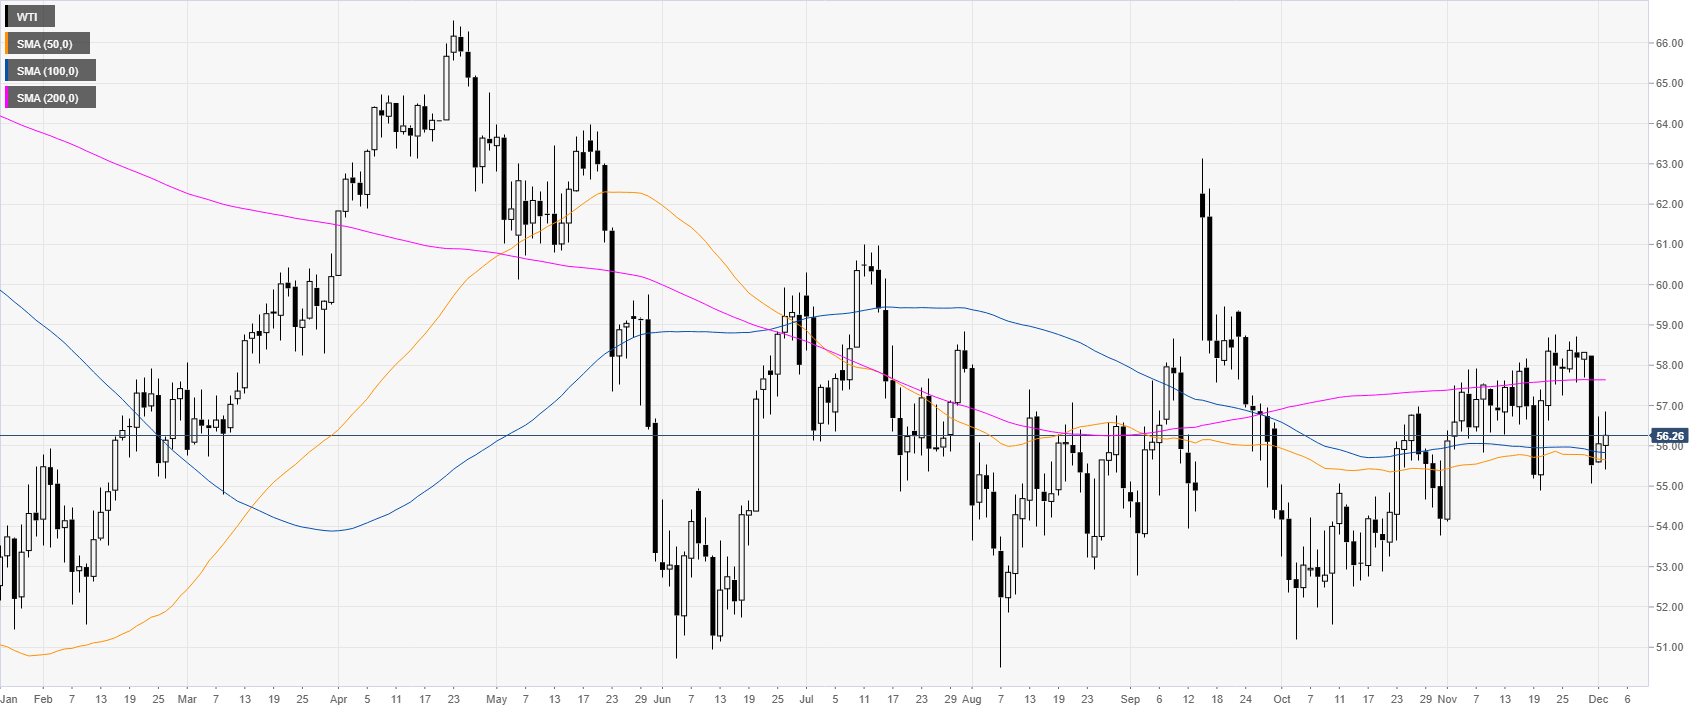
Crude oil daily chart
The crude oil West Texas Intermediate (WTI) is currently trading just above $56.00 a barrel and the 50/100 DMAs consolidating last week’s drop.
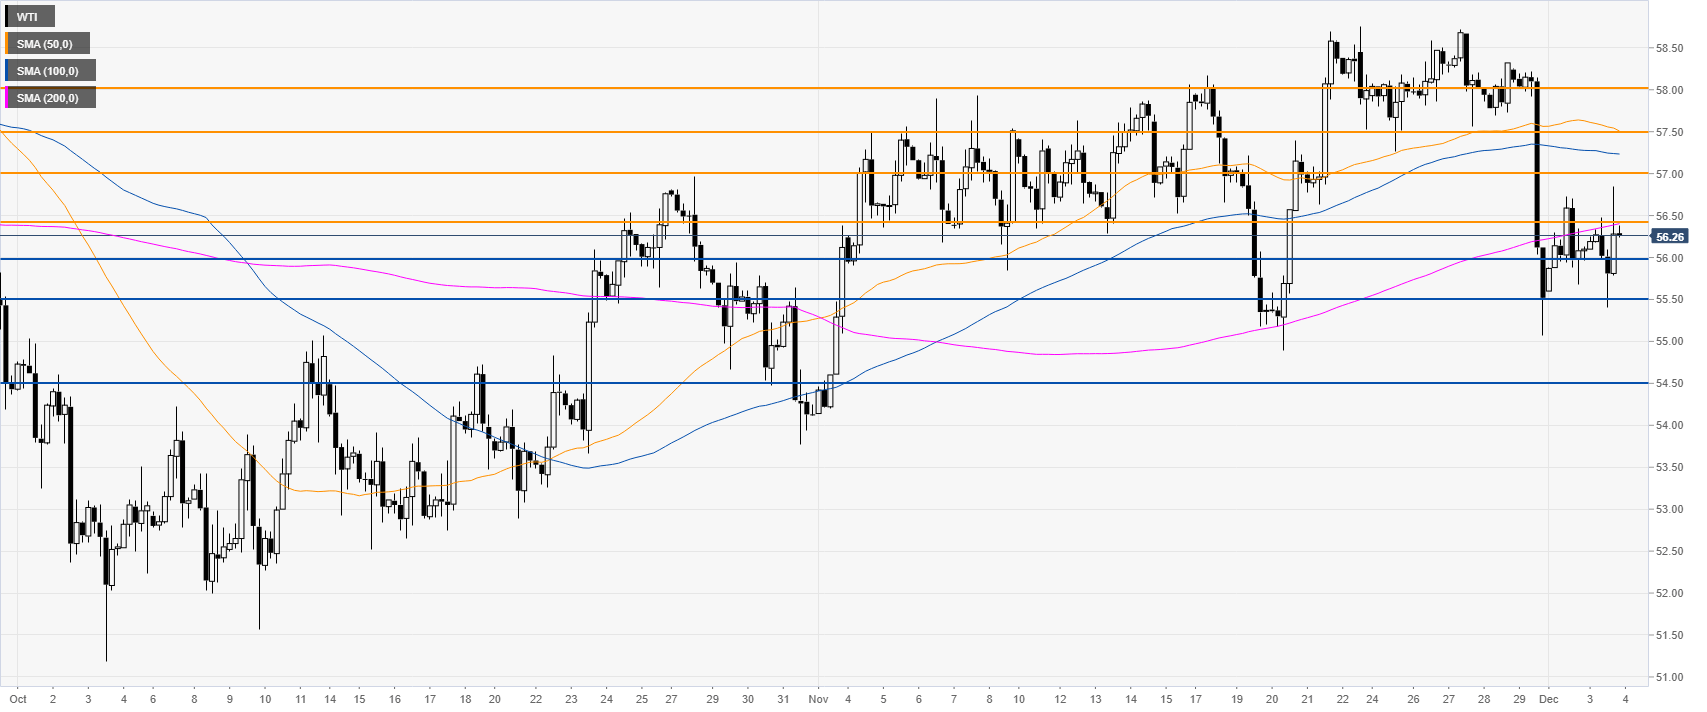
Crude oil four-hour chart
Black gold is correcting the recent drop below the 200 SMA on the four-hour chart. The market is vulnerable to the downside. However, further consolidation could be on the cards in the medium term.
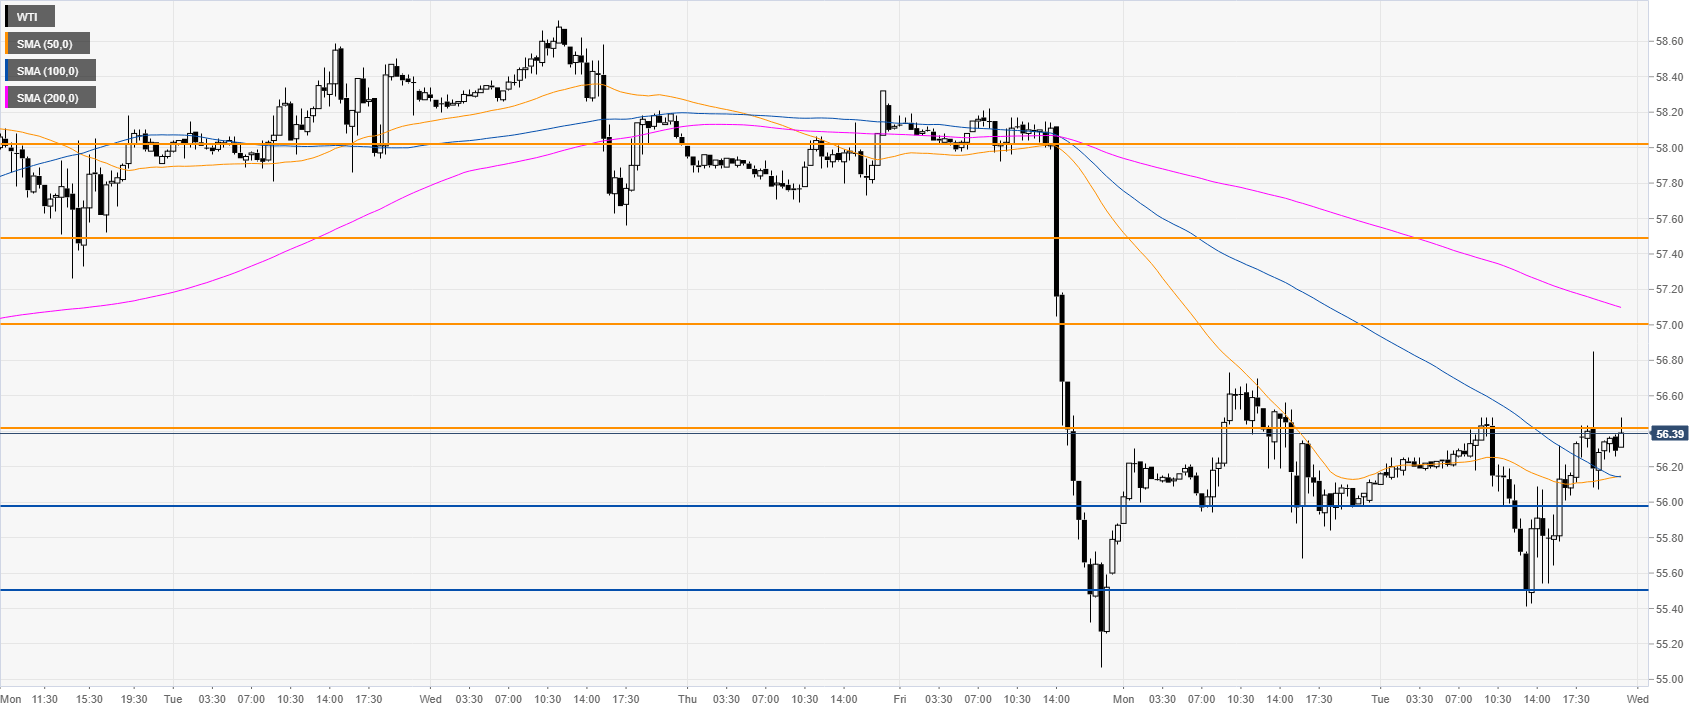
Crude oil 30-minute chart
WTI is trading below a downward 200 SMAs, suggesting a bearish bias in the near term. However, the market could correct up and break the 56.40 level and reach the 57.00 handle. On the flip side, sellers want a daily close below the 56.00 level to drive the price towards the 54.50 level.
Additional key levels