AUD/JPY Technical Analysis: Sellers await rising wedge confirmation amid bearish MACD
- AUD/JPY stays positive around three weeks’ high.
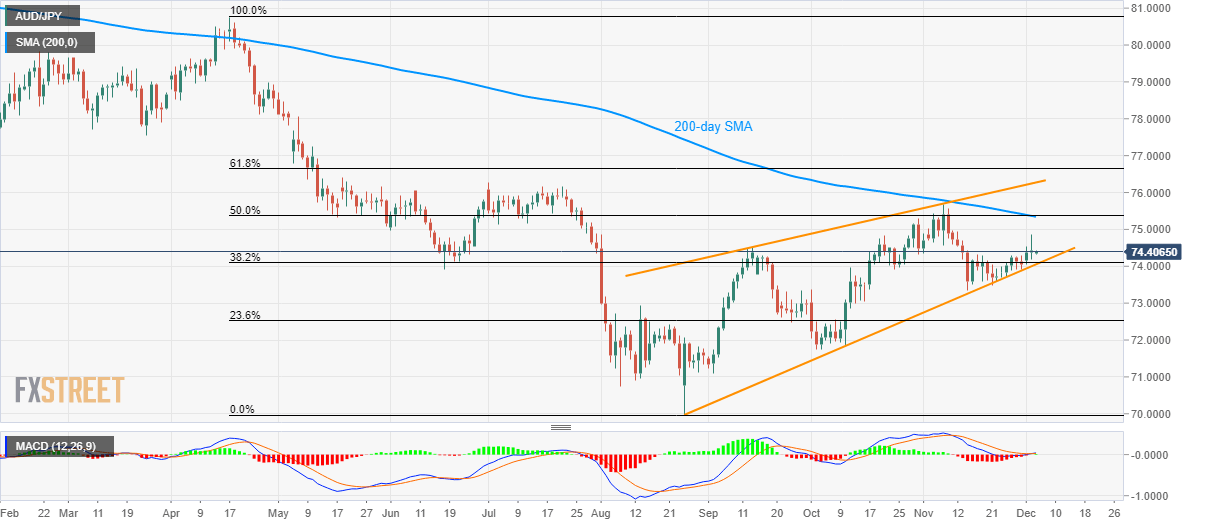
- Nearness to the bearish formation’s support, trading below key resistance confluence push sellers to look for entry.
- Upside capped by 200-day SMA, 50% Fibonacci retracement.
AUD/JPY takes the bids near 74.40 by the press time of early Wednesday morning in Asia. The quote nears the highest levels in three weeks.
Even so, its proximity to the rising wedge’s support, a bearish chart formation, coupled with the downbeat histogram of the 12-bar Moving Average Convergence and Divergence (MACD), keep sellers hopeful.
In doing so, there are looking for a daily closing below 74.00 to take aim at 23.6% Fibonacci retracement of April-August fall, at 72.52, ahead of diverting bears to early August low near 70.75 and 70.00 round-figure.
Meanwhile, Tuesday’s high near 74.85 and 75.00 mark could entertain buyers while a confluence of 200-day Simple Moving Average (SMA) and 50% Fibonacci retracement near 75.35/40 will become a tough nut to crack for the bulls.
It’s worth mentioning that Australia’s third-quarter (Q3) Gross Domestic Product (GDP) data, up for publishing at 00:30 GMT, becomes an immediate key catalyst to watch. Forecasts suggest YoY figure to improve to 1.7% from 1.4% while the QoQ level is less likely to deviate from 0.5%.
AUD/JPY daily chart
Trend: Pullback expected