USD/CNH Technical Analysis: Eyes on 61.8% Fibonacci after China’s Caixin Services PMI
- USD/CNH pulls back after China data.
- China’s November month Caixin Services PMI rose past expectations and prior.
- 200-bar SMA, 38.2% Fibonacci retracement restrict near-term declines.
USD/CNH drops to 7.0730 after China’s data beat expectations on early Tuesday.
November month Caixin Services Purchasing Managers’ Index (PMI) data from China rose beyond 52.7 expected and 51.1 prior to 53.7.
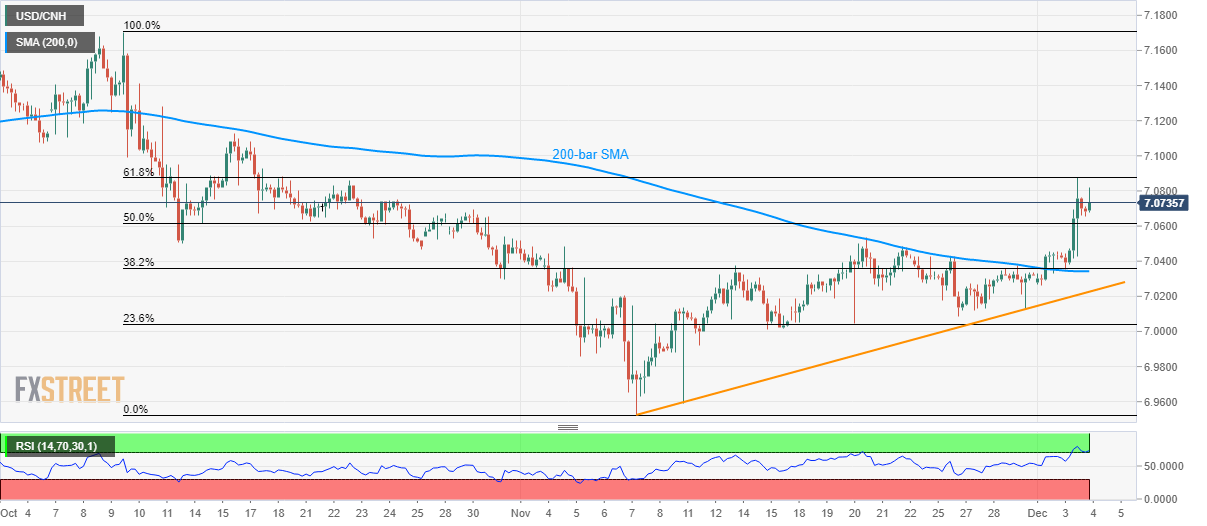
The overbought conditions of the 14-bar Relative Strength Index (RSI), coupled with repeated failures to cross 61.8% Fibonacci retracement of October-November fall, increase the odds of pair’s pullback.
In doing so, a 50% Fibonacci retracement level of 7.0617 and November 21 high near 7.0535 can act as immediate supports. However, 7.0360/40 region including 200-bar Simple Moving Average (SMA) and 38.2% Fibonacci retracement could restrict the pair’s further declines.
Additionally, an upward sloping trend line since November 07, at 7.0225, could gain bears’ attention afterward.
On the flip side, a sustained rise beyond 61.8% Fibonacci retracement of 7.0875 could extend the pair’s north-run towards mid-October high around 7.1130.
USD/CNH four-hour chart
Trend: Pullback expected