16 Dec 2019
GBP/USD Price Analysis: Pound correcting the election breakout, trades near 1.3340 level
- The pound is correcting down from 17-month highs.
- Support is seen at the 1.3343, 1.3307 and 1.3246 price levels.
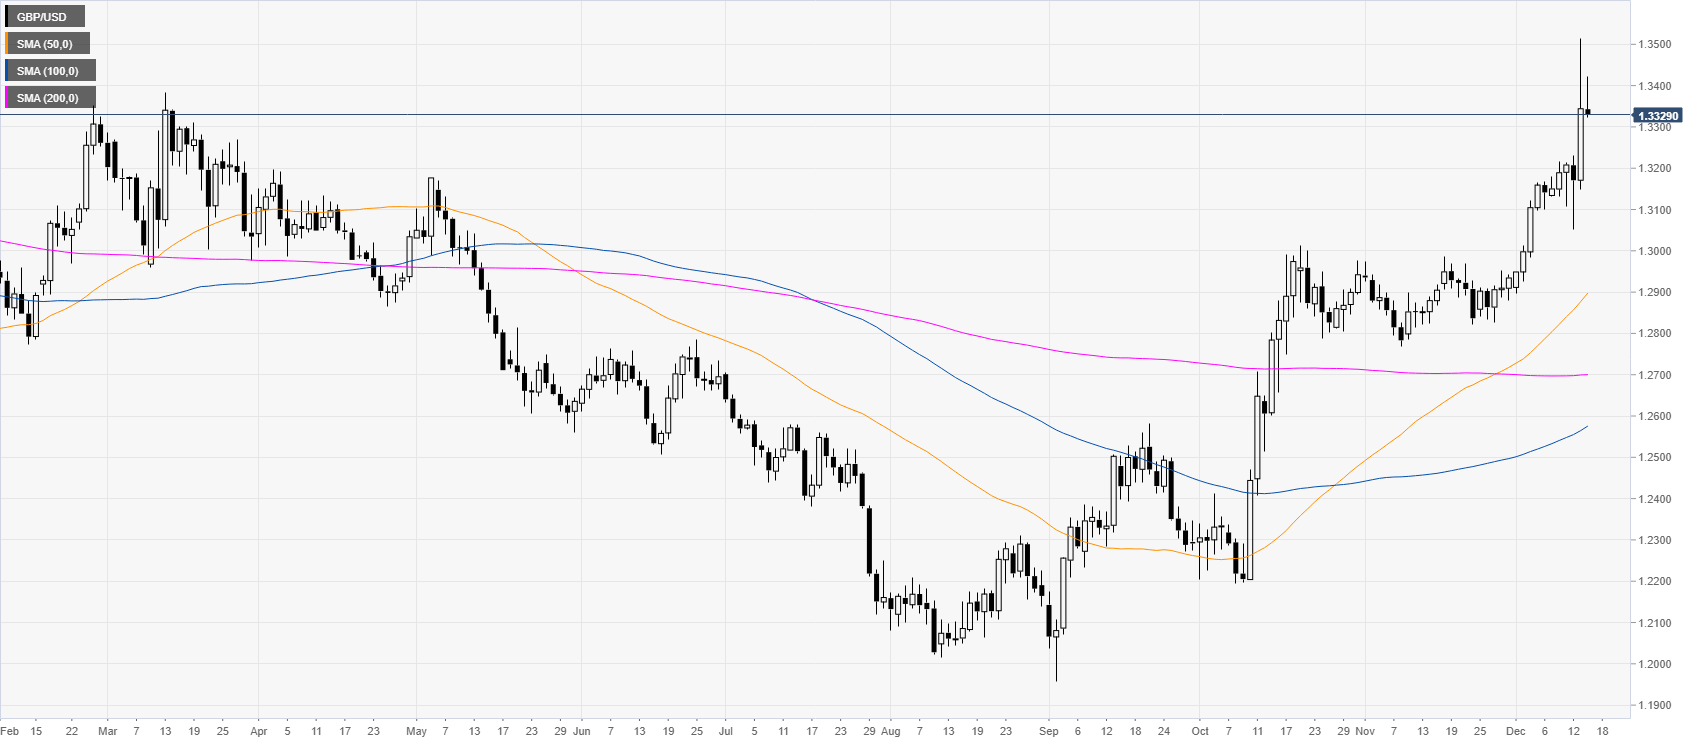
GBP/USD daily chart
The market is consolidating after reaching 17-month highs on UK elections last week. The underlying trend remains bullish while above the main daily SMAs.
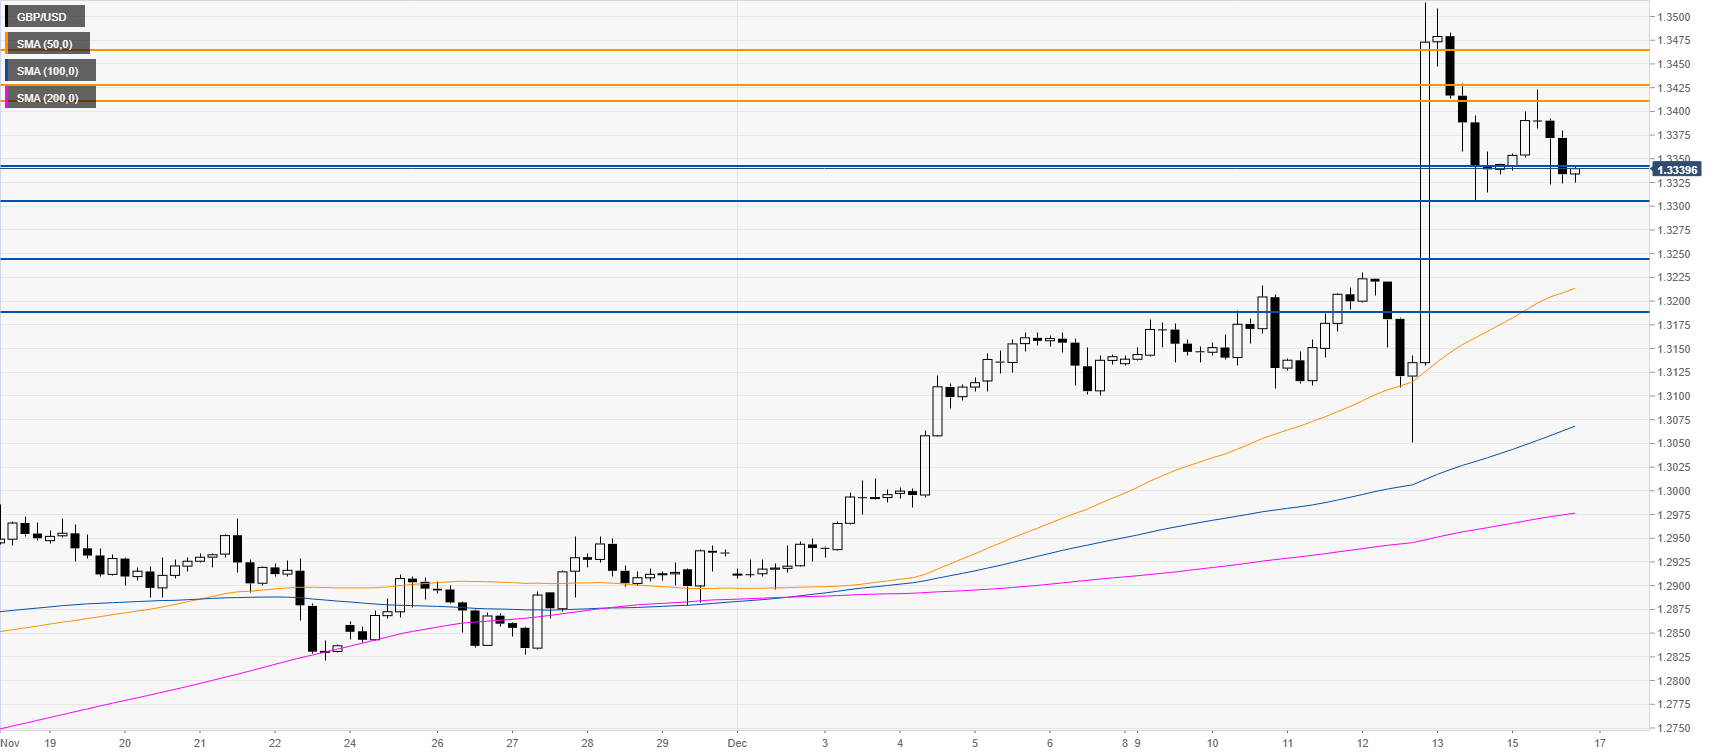
GBP/USD four-hour chart
GBP/USD is pulling back down after the huge bullish breakout. The market is testing the 1.3343 support. If the correction conclusively breaks below this level, the spot could continue to weaken towards the 1.3307 and 1.3246 price levels, according to the Technical Confluences Indicator.
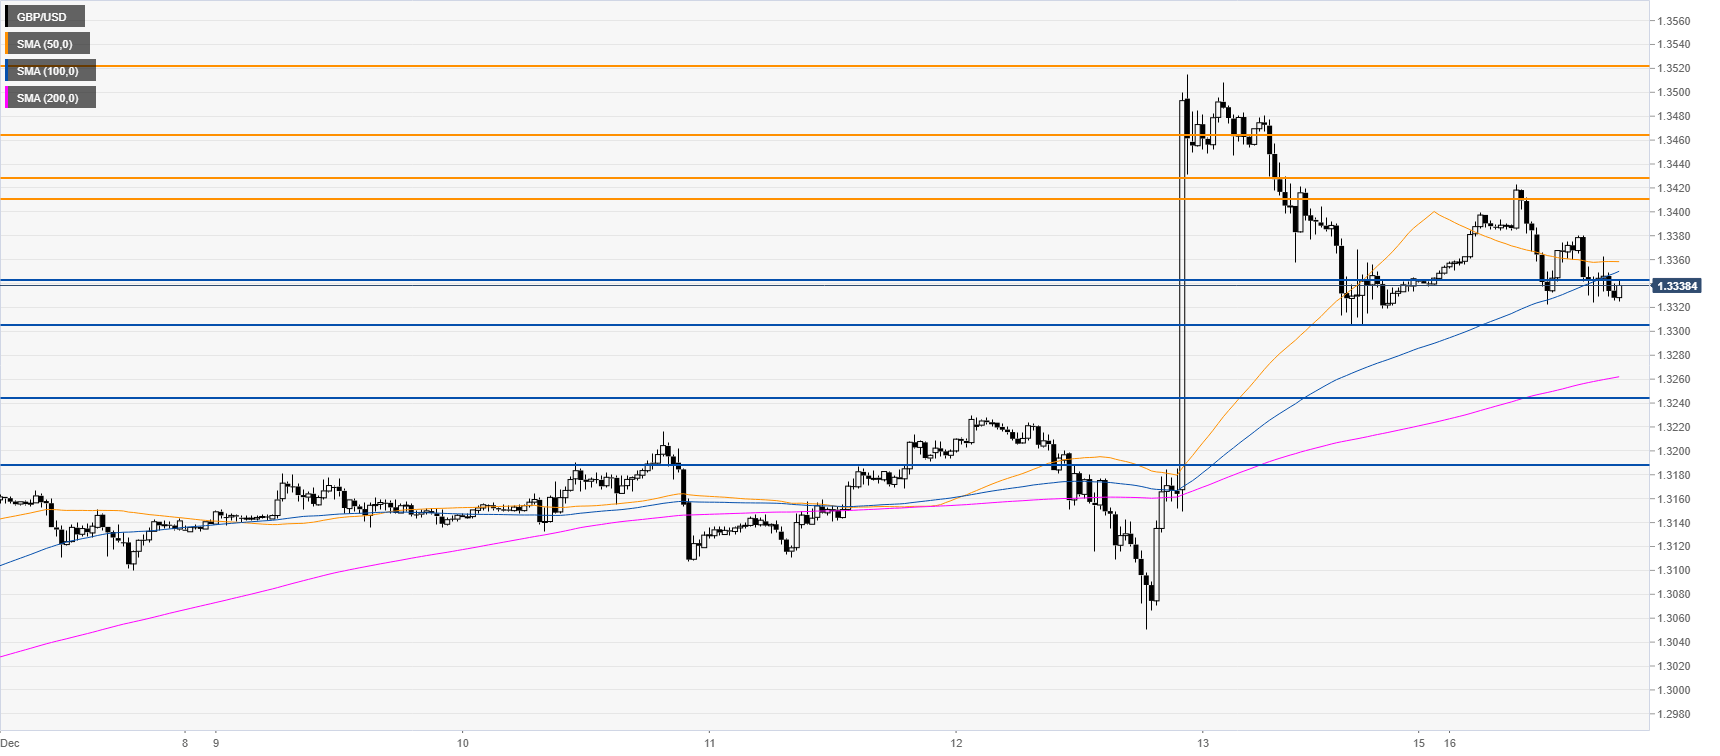
GBP/USD 30-minute chart
The spot is drifting below the 50/100 SMAs. Bulls are for the moment on the sideline. Resistance is seen at 1.3413, 1.3430 and at the 1.3424 level, according to the Technical Confluences Indicator.
Additional key levels