3 Jan 2020
US Dollar Index Price Analysis: DXY in murky waters after disappointing ISM Manufacturing PMI
- DXY recovery is losing strength after disappointing ISM Manufacturing PMI.
- A break below 96.70 could lead to further losses towards the 96.50 and 96.25 levels.
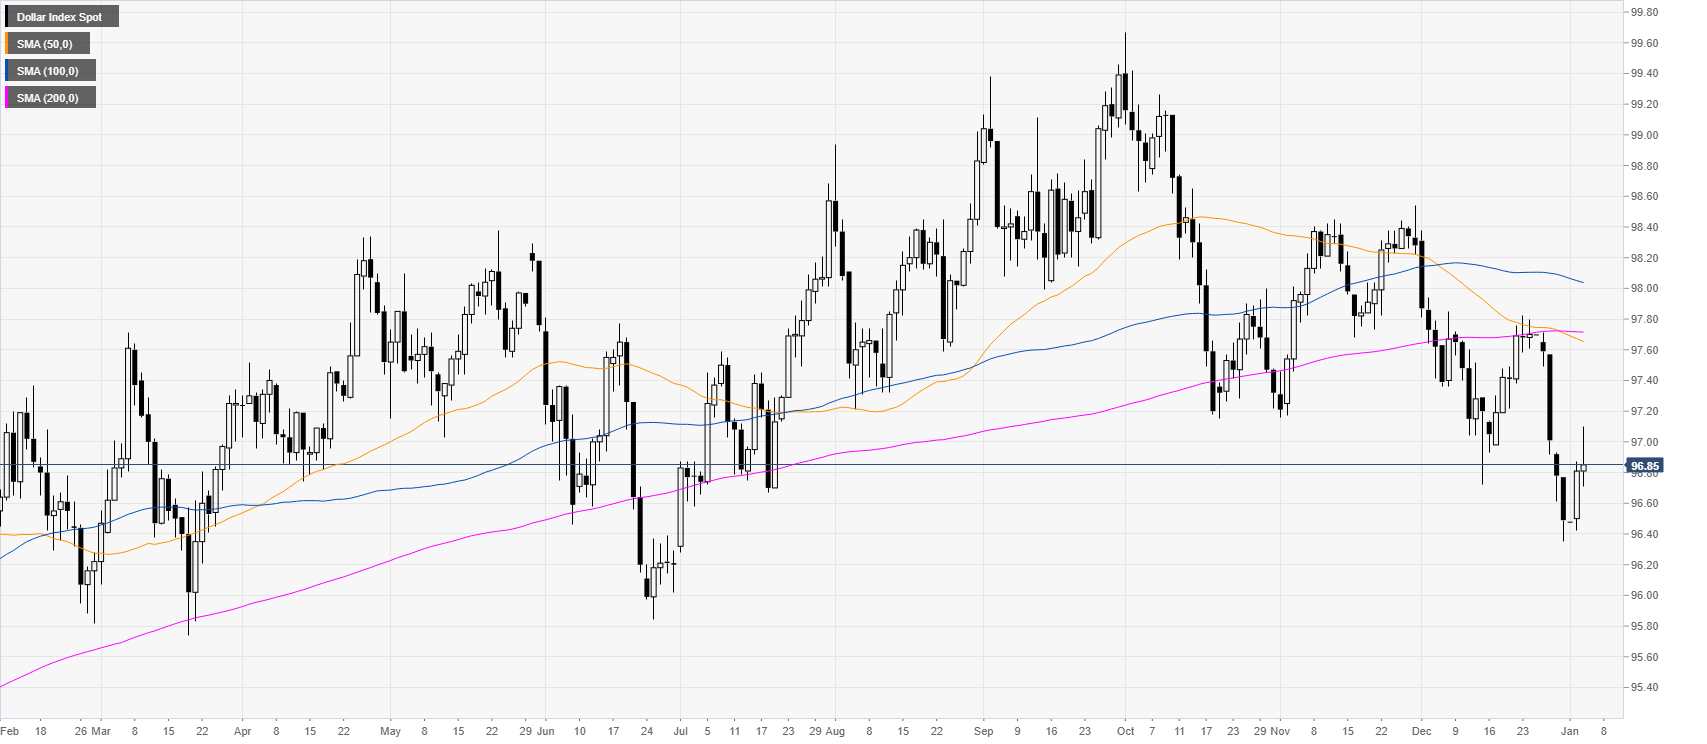
DXY daily chart
The greenback remains under pressure below the main daily simple moving average (SMAs). DXY had a bounce on Thursday, but Friday’s US Data is undermining the potential recovery. ISM Manufacturing PMI drops to 47.2 in December vs. 49 expected.
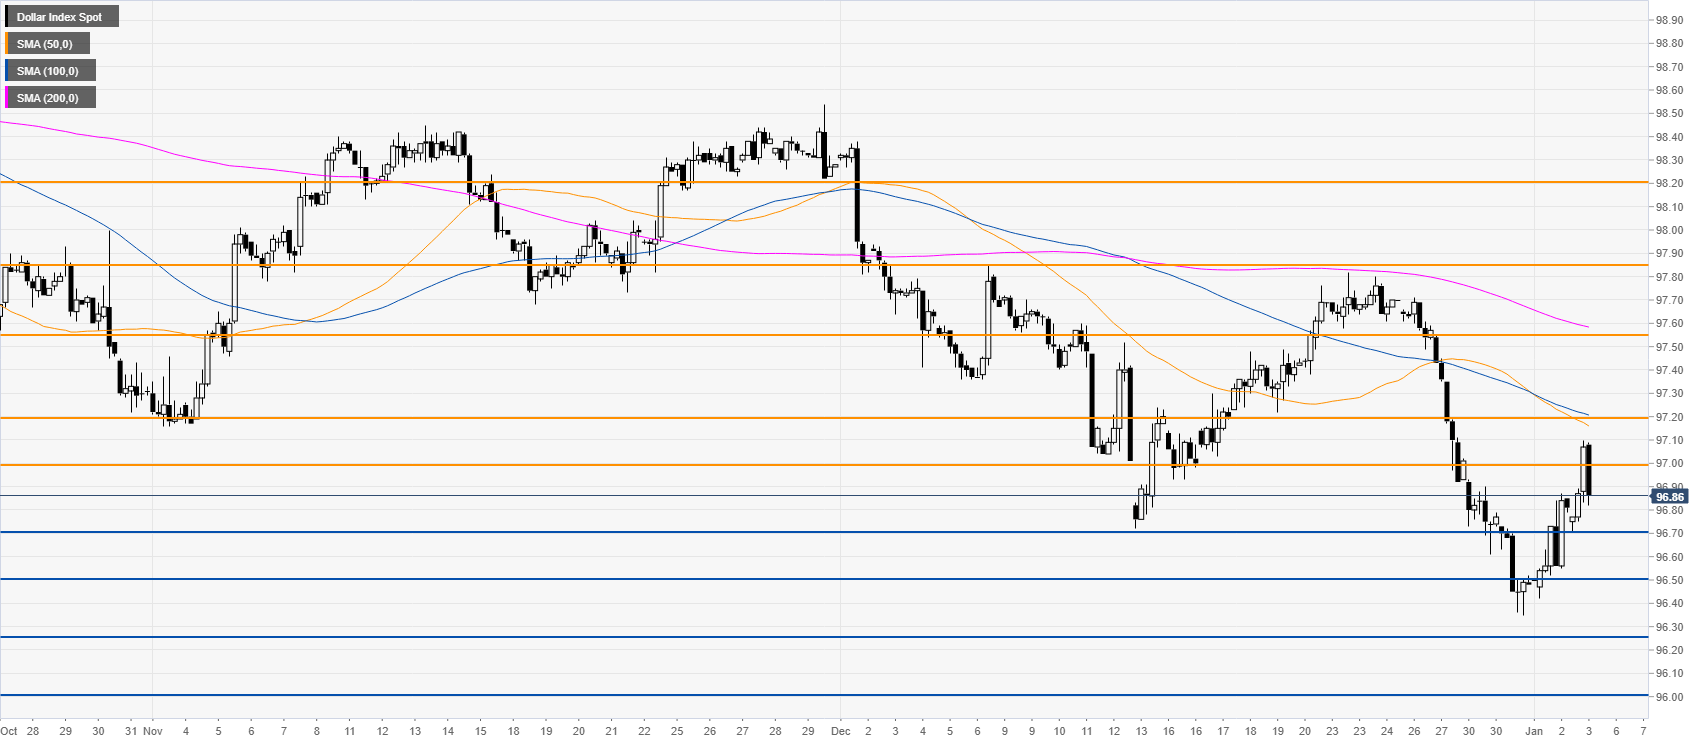
DXY four-hour chart
The US dollar is rejecting the 97.00 handle just below the 50/100 SMAs, slowing down the recovery. The current pullback can be seen as a bear flag in a bear trend, giving the sellers the advantage in the medium term. A break below 96.70 could lead to further losses towards the 96.50 and 96.25 levels. On the flip side, if the buyers generate enough momentum and can have a daily close above 97.20, the market could have a deeper retracement up and trade towards 97.55.
Additional key level