9 Apr 2020
US Dollar Index Price Analysis: DXY dips below 100.00 figure as Fed adds $2.3 trillion to its balance sheet
- US dollar index (DXY) is consolidating gains below the 100.00 mark.
- Support can emerge near the 99.50 and 99.00 levels.
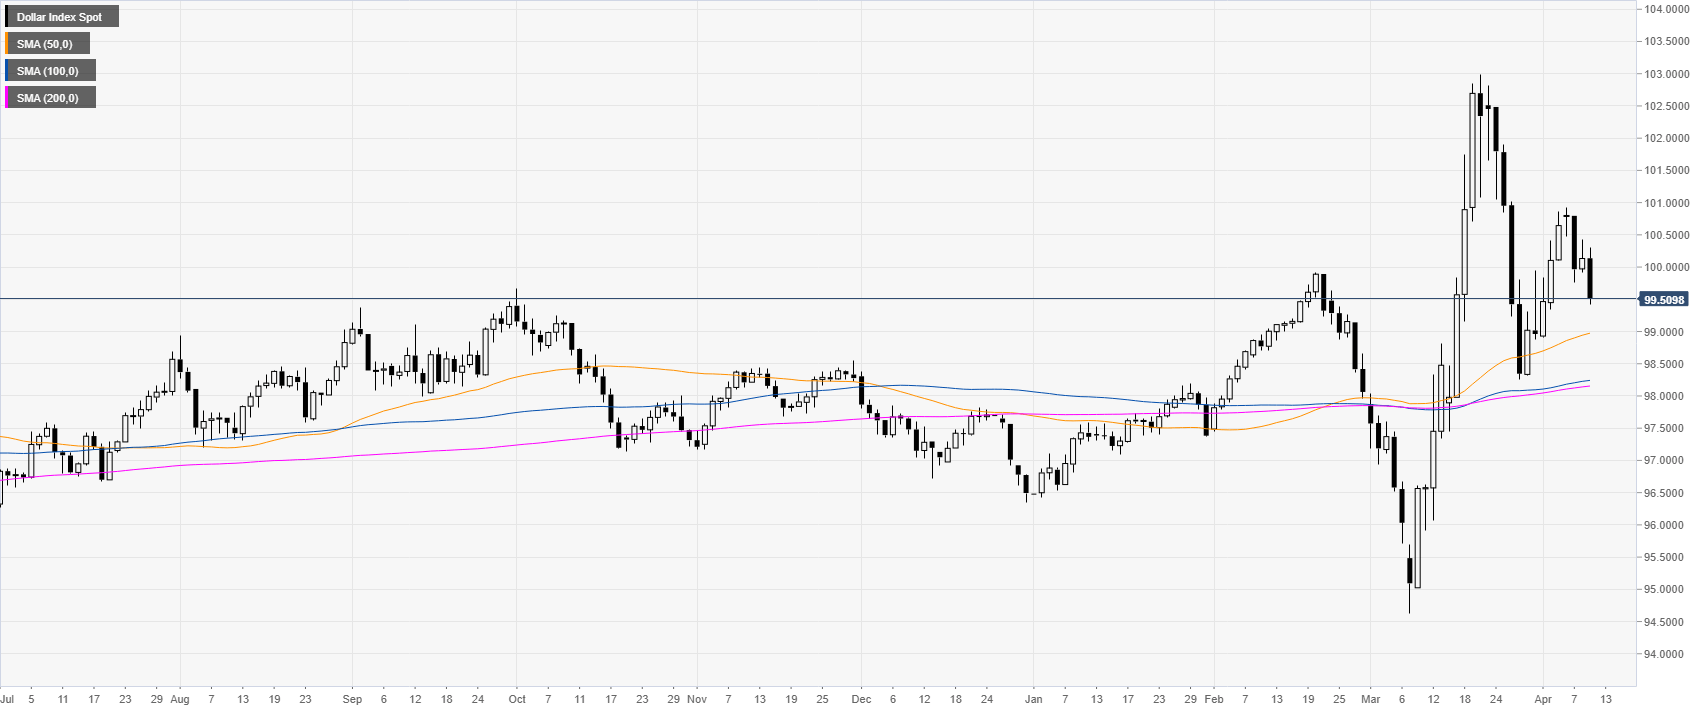
DXY daily chart
DXY is trading in a bull trend above the main daily SMAs, however, the greenback is losing steam below the 100.00 figure this Thursday as the Fed announced it will inject $2.3 trillion in additional loans while US jobless claims are above 6.6 million.
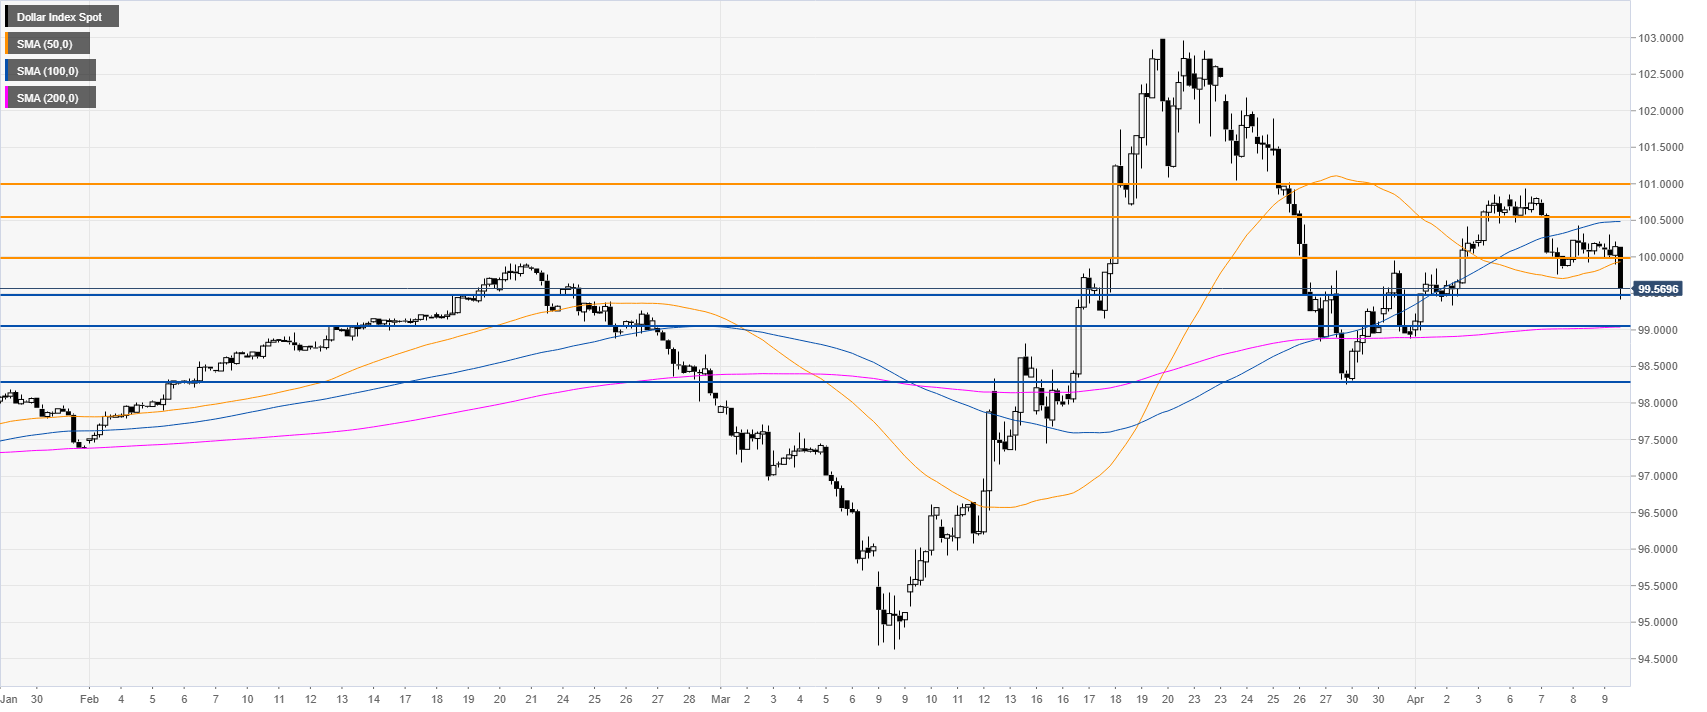
DXY four-hour chart
DXY is taking a breather below the 50/100 SMAs but above the 200 one suggesting that the bull trend remains intact. The market is challenging the 99.50 level which bull will attempt to defend. A bounce here can see buyers going for the 100.00 figure and above. Support is seen near the 99.00 and 98.30 levels.
Additional key levels