14 Apr 2020
Silver New York Price Forecast: XAG/USD bullish in one-month tops
- XAG/USD holds onto gains in one-month highs.
- The level to beat for bulls is the 16.20 resistance.
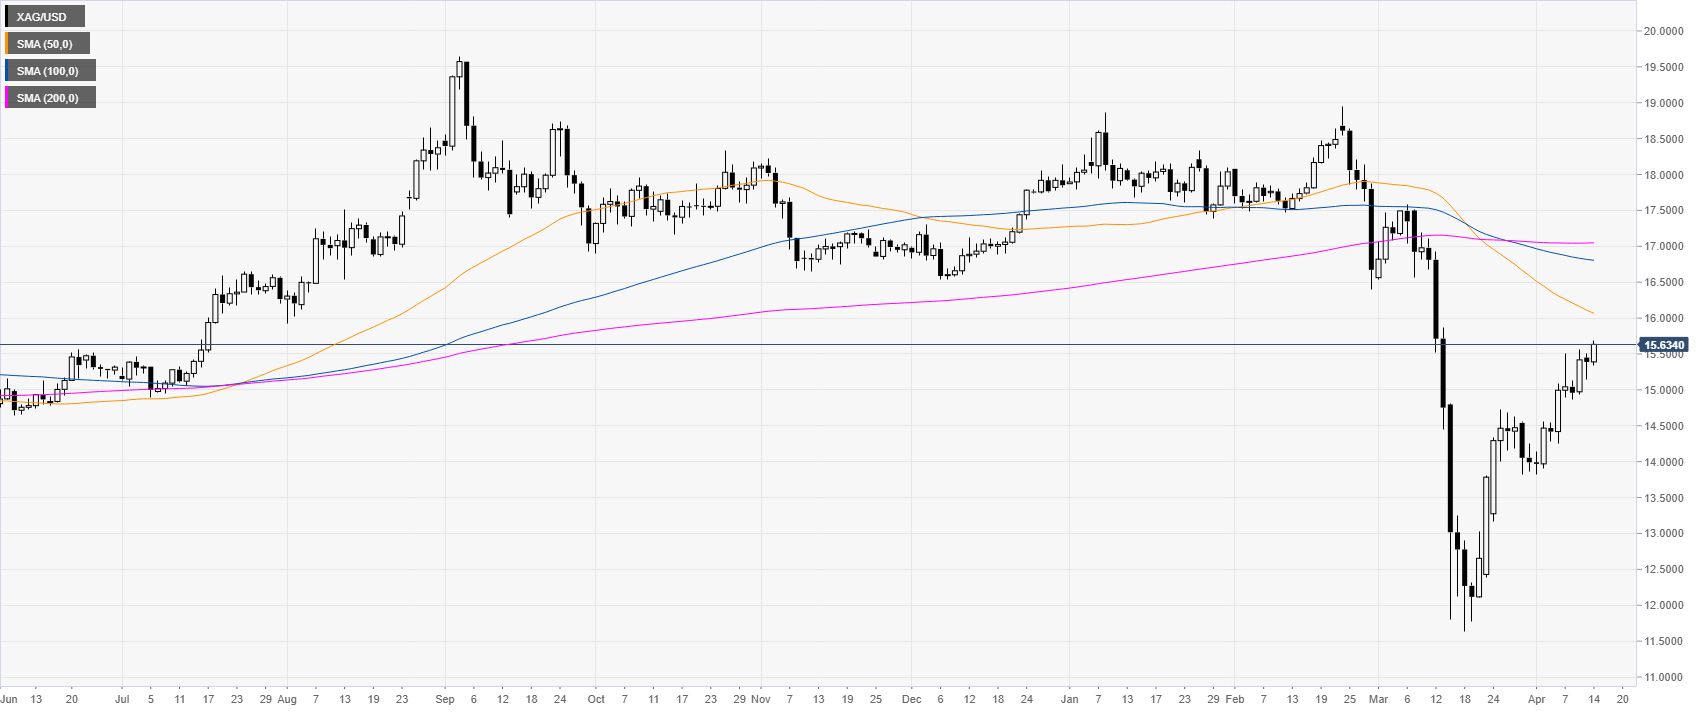
Silver daily chart
After the dramatic selloff to 2009 lows, XAG/USD is bouncing up as the Fed introduced a limitless Quantitative Easing (QE) in addition to the injection of $2.3 trillion in loans.
Silver four-hour chart
XAG/USD is breaking above 15.50 resistance level while trading above the mains SMAs on the four-hour chart as buyers are extending the bullish move towards the 16.20 and 16.60 levels. Support emerge near the 15.00, 14.50 and 14.00 levels on any retracement.
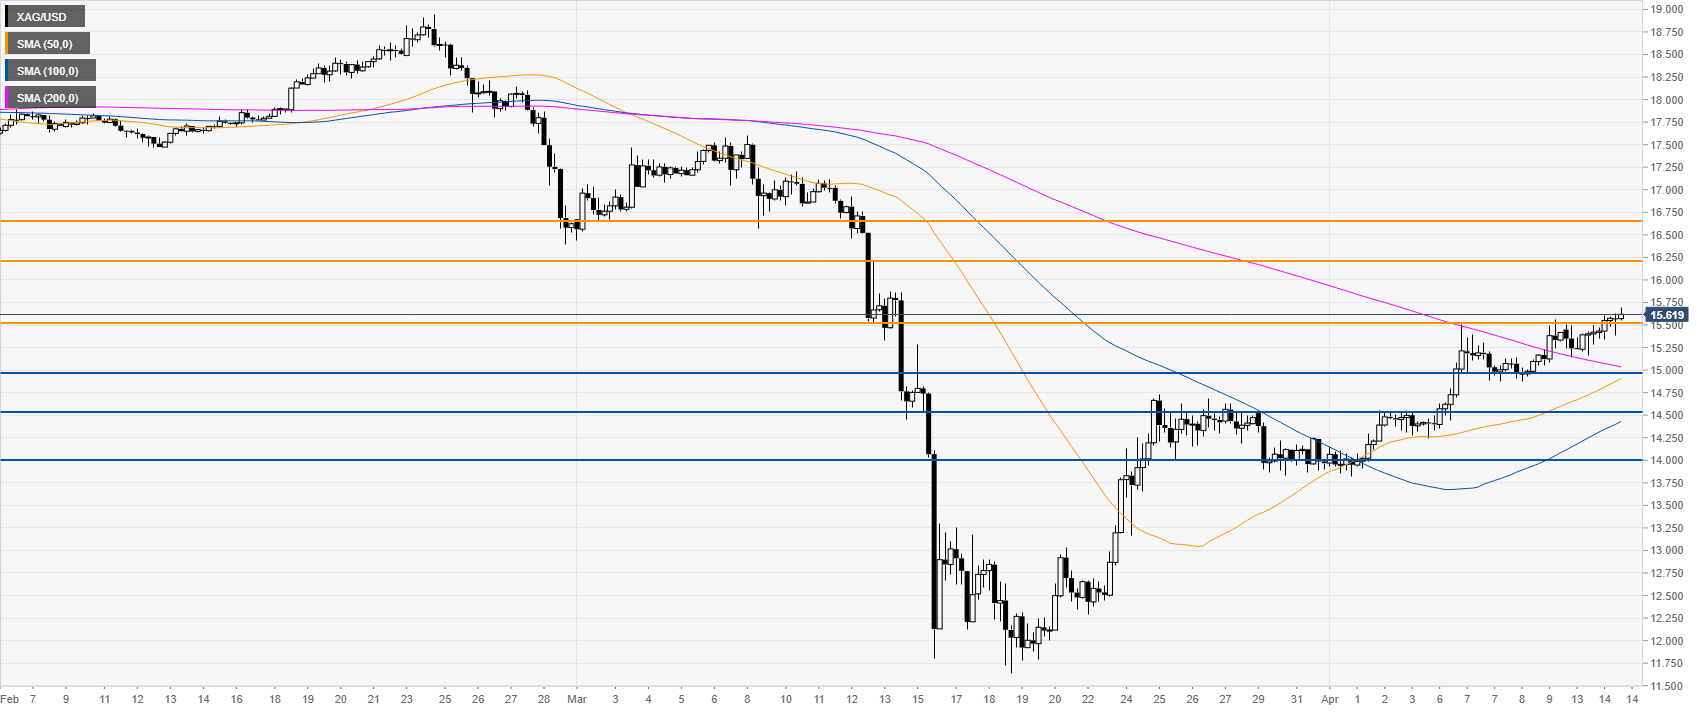
Resistance: 15.50, 16.20, 16.60
Support: 15.00, 14.50, 14.00
Additional key levels