15 Apr 2020
GBP/JPY Price Analysis: Struggles around five-week-old resistance trendline
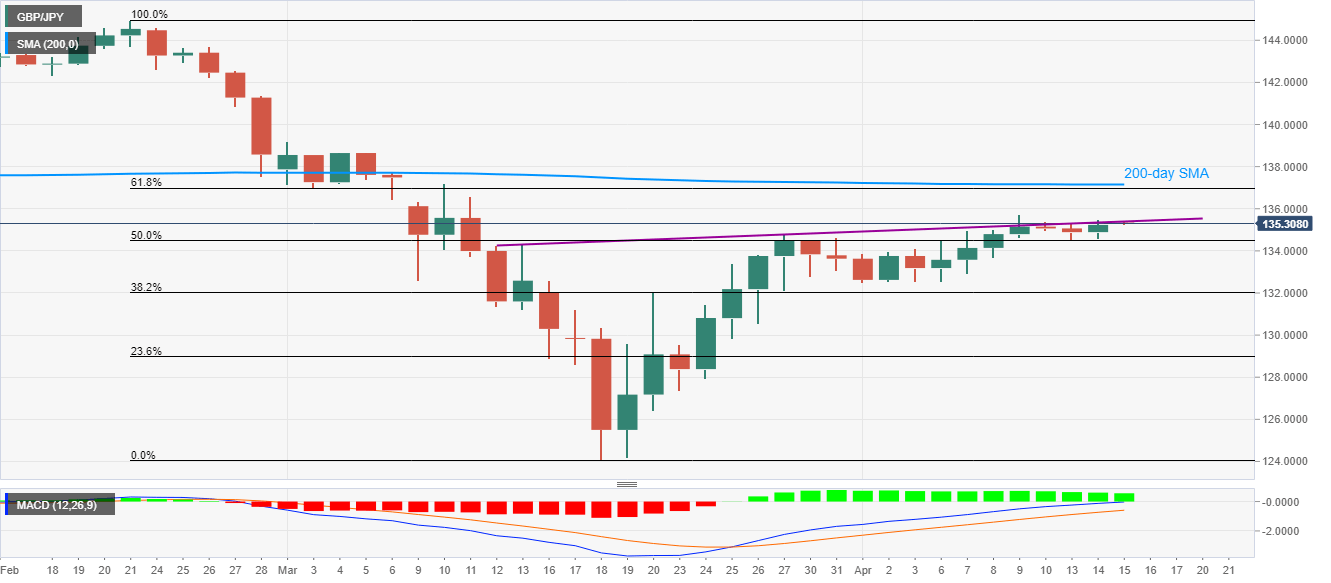
- GBP/JPY retraces from the short-term key resistance line, stays beyond 50% Fibonacci retracement.
- 61.8% Fibonacci retracement, 200-day SMA offer additional filters to the upside.
- Multiple rest-points around the monthly low can entertain sellers during further declines.
GBP/JPY consolidates the latest recovery gains to 135.30 amid the early Asian session on Wednesday. In doing so, the pair steps back ascending trend line stretched since March 12 while also staying above 50% Fibonacci retracement level of February-March downside.
While bullish MACD and sustained trading beyond the key Fibonacci retracement favor the buyers, the quote needs to provide a successful break above 135.40 to escalate the run-up towards 61.8% Fibonacci retracement level of 137.00.
Even so, 200-day SMA, currently around 137.15, could keep the bulls in check beyond 135.40.
Alternatively, the pair’s declines below 134.50, comprising 50% Fibonacci retracement, can recall the monthly lows near 132.50/45.
GBP/JPY daily chart
Trend: Bullish