16 Apr 2020
Silver New York Price Forecast: XAG/USD trading near one-month tops around $15.50/oz
- XAG/USD is trading off one-month highs but the recovery is intact.
- The level to beat for bulls is the 15.80 resistance.
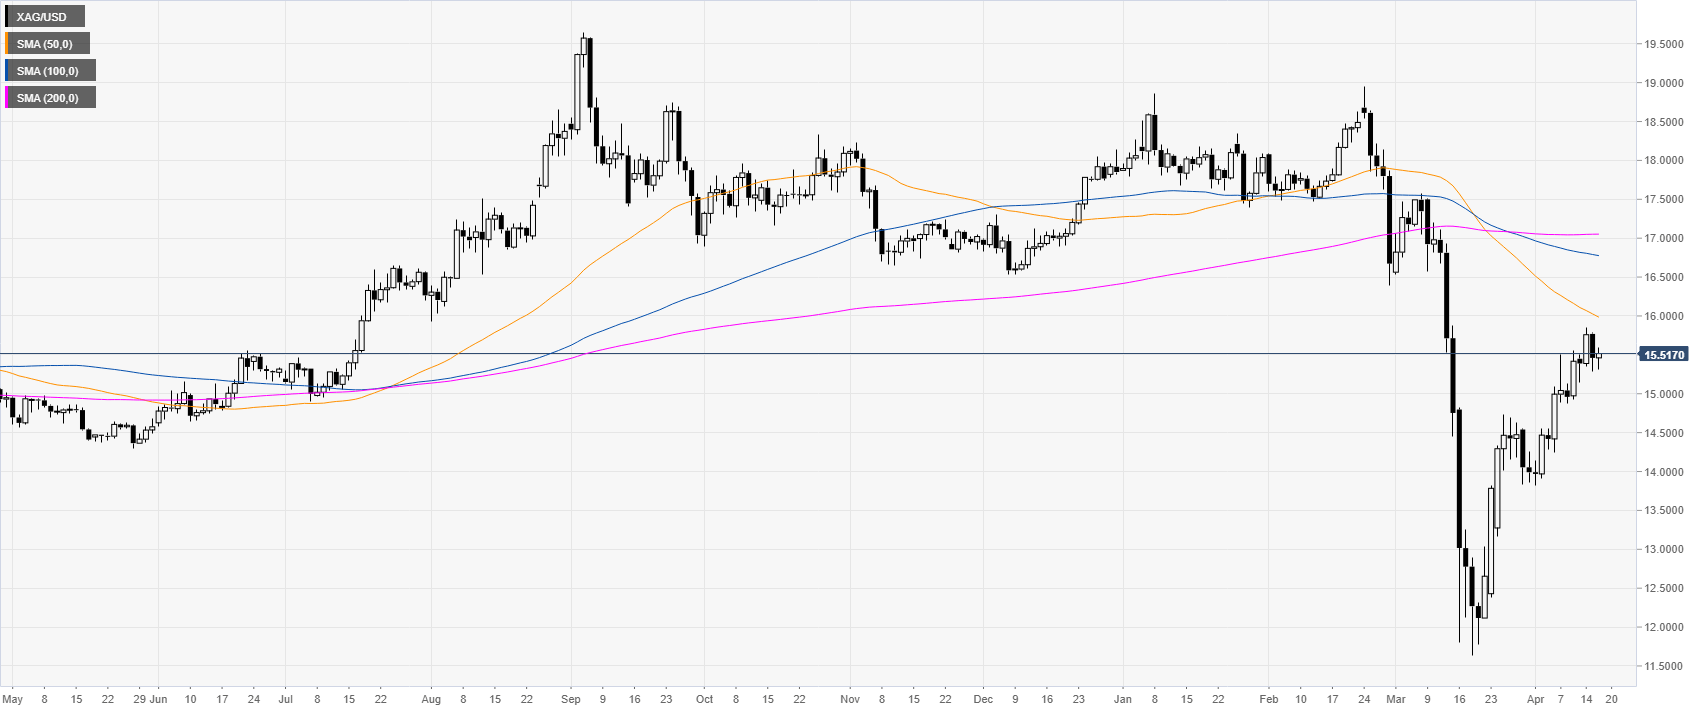
Silver daily chart
After the sharp selloff to 2009 lows, XAG/USD is bouncing up as the Fed launched a limitless Quantitative Easing (QE). However, XAG/USD remains below its main SMAs on the daily chart.
Silver four-hour chart
XAG/USD recovery remains intact as it is trading above the main SMAs on the four-hour chart printing higher highs and lows. Buyers are looking for a daily close above the 15.80 resistance opening the doors to further gains towards the 16.20 and 16.60 levels. Support can emerge near the 15.00, 14.50 and 14.00 levels.
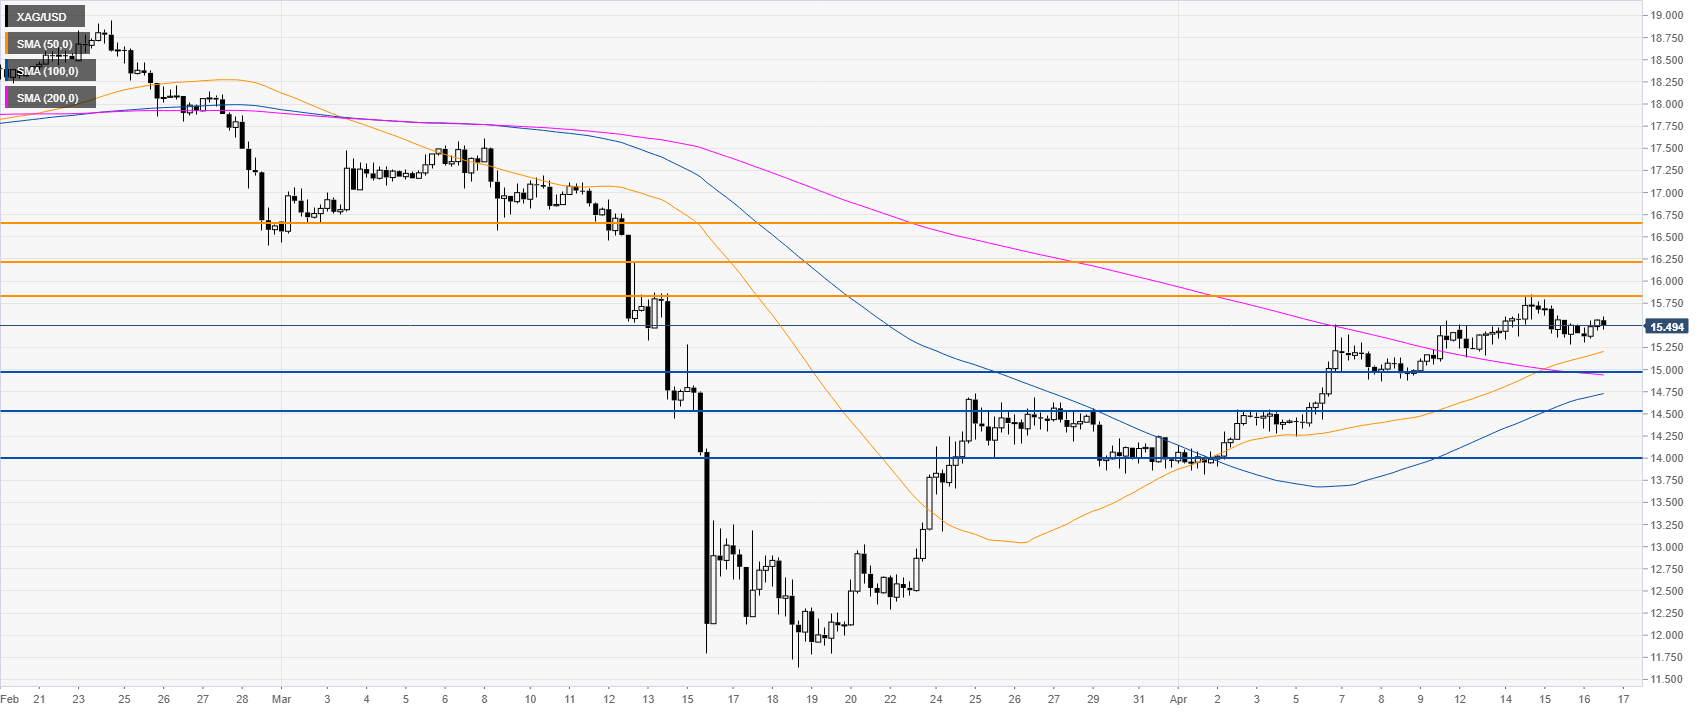
Resistance: 15.80, 16.20, 16.60
Support: 15.00, 14.50, 14.00
Additional key levels