USD/CAD Price Analysis: Bulls pierce 1.4100 in search of six-week-old resistance line
- USD/CAD extends pullback from 50-day EMA to a five-day top.
- The monthly resistance line adds to the support.
- April high follows the trend line breakout during further upside.
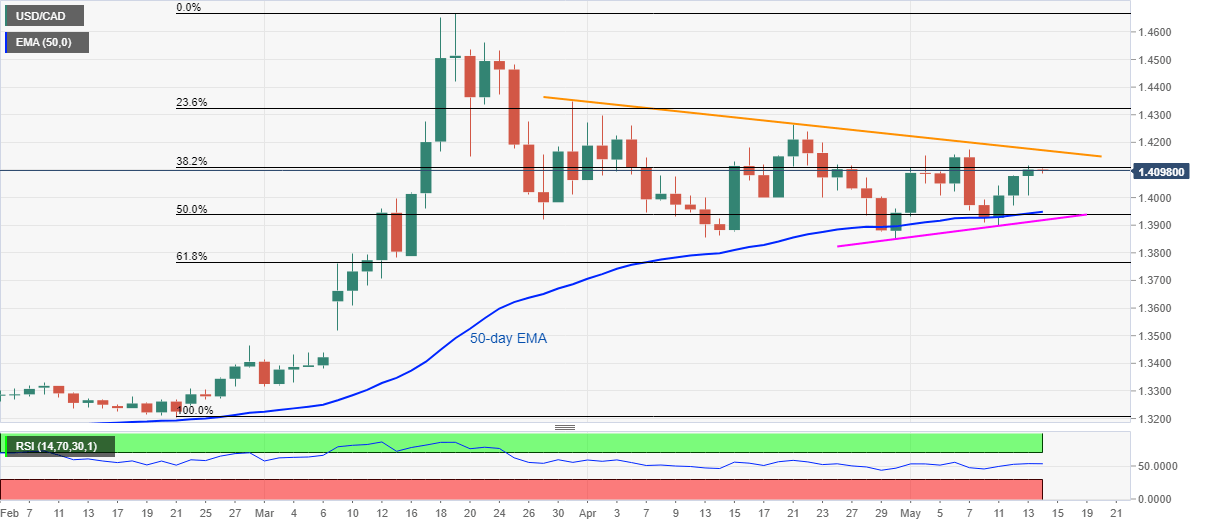
USD/CAD seesaws near the five-day high of 1.4100 amid the Asian session on Thursday. The pair’s sustained recovery moves from the key EMA, short-term support line keeps buyers hopeful.
As a result, a falling trend line from March 31, around 1.4175, seems to be on the bulls’ radars ahead of targeting to challenge the previous month peak of 1.4265.
During the pair’s further rise past-1.4265, the March-end high of 1.4350 and 1.4540 can lure the optimists before pushing them towards the yearly peak close to 1.4670.
Meanwhile, 1.4000 round-figure could entertain sellers during the fresh declines. Further, a confluence of 50-day EMA and 50% Fibonacci retracement of February-March upside, near 1.3950/40, could challenge the bears afterward.
In a case where USD/CAD prices drop below 1.3940, an ascending trend line from April 30 could validate further downside towards 1.3850 comprising the April month bottom.
USD/CAD daily chart
Trend: Bullish