GBP/USD Price Analysis: Buyers attack 1.2200 following Monday’s spinning top
- GBP/USD awaits further direction to extend recoveries from 1.2160/65.
- Candlestick formation suggests the fight between the buyers and sellers after three-day losing streak the last week.
- 50-day SMA guards near-term upside, sellers can aim for fresh monthly low.
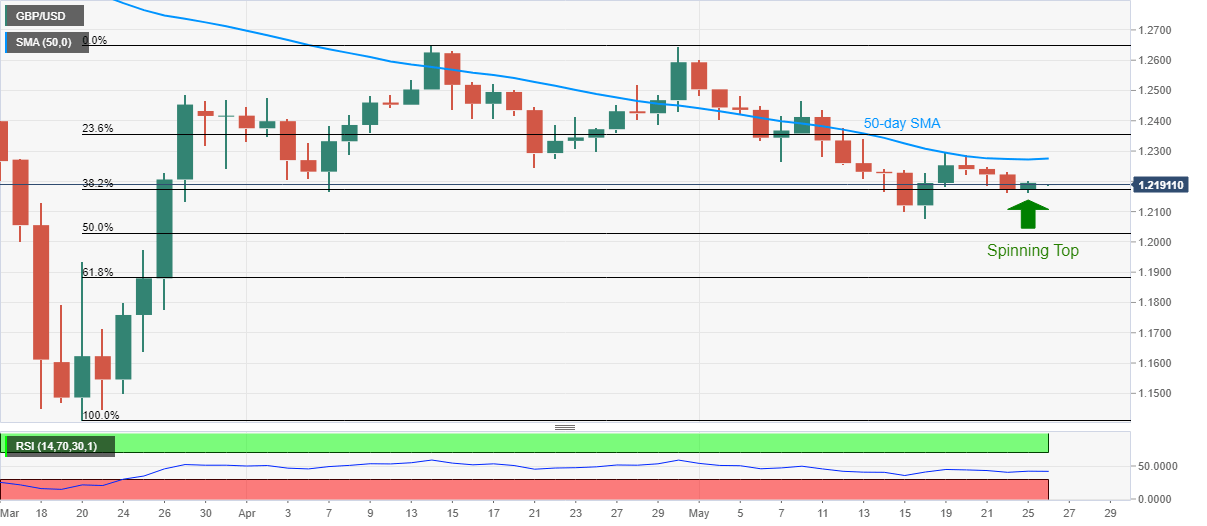
GBP/USD takes the bids to 1.2195 during the initial Asian session on Tuesday. The pair formed a bullish “spinning top” candlestick on the daily chart the previous day after consecutive three days of downside.
While the candlestick formation portrays the struggle between the buyers and the sellers, 50-day SMA keeps the quote’s near-term upside guarded.
As a result, the current recovery moves may initially aim for a 50-day SMA level of 1.2275 ahead of targeting 1.2300 mark comprising high of May 19.
Should the bulls manage to keep the reins beyond 1.2300, May 08 top near 1.2470 and 1.2500 round-figure could return to the charts.
On the downside, pair’s declines below Friday’s low of 1.2162 can recall the bears targeting to refresh the monthly bottom below 1.2075.
GBP/USD daily chart
Trend: Further recovery expected