EUR/USD has found support just ahead 1.12 but the level still looks vulnerable
- EUR/USD trades 0.39% lower on Wednesday as the dollar firms across the board.
- A new wave low has been made on the hourly chart but some intraday buyers have stepped in.
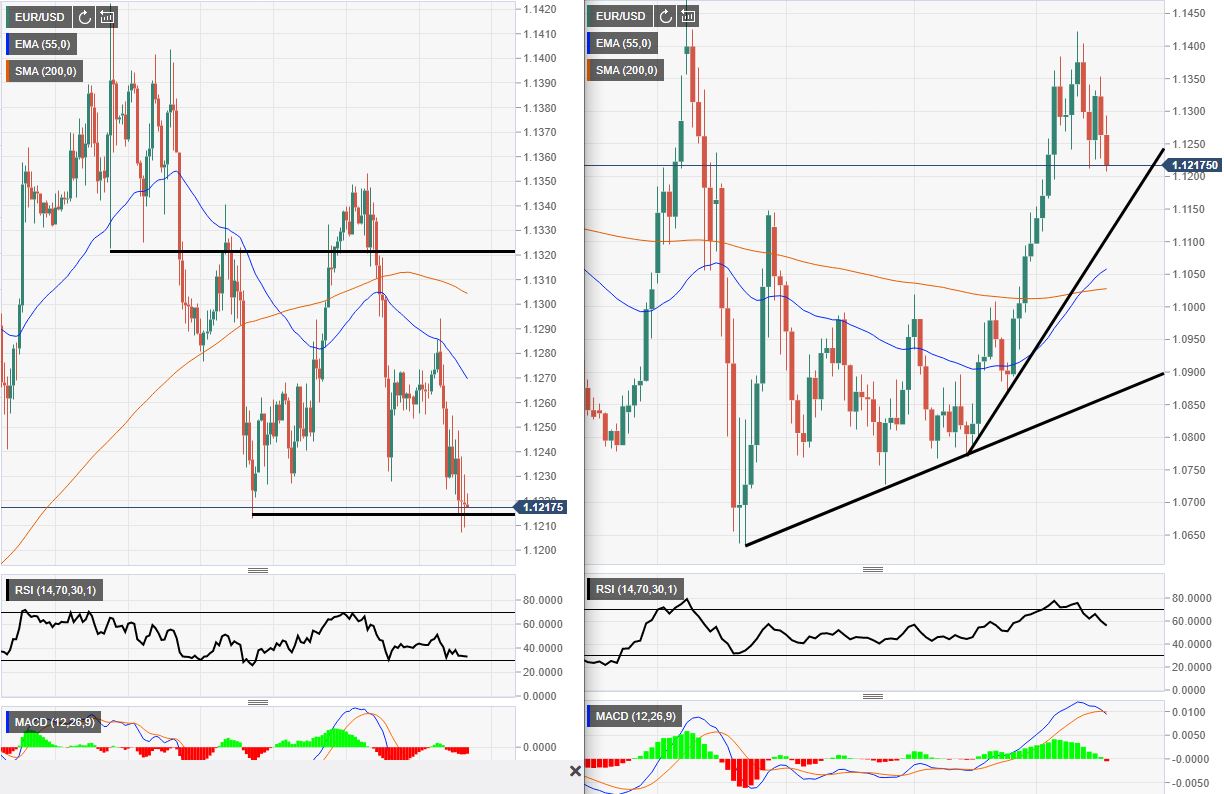
EUR/USD 1-hour (left) and daily (right) charts
EUR/USD has taken a dive on Wednesday as some USD strength kicked in during a risk-off stint in equity markets. Looking at the chart on the left-hand-side and the waves are making a lower high lower low pattern. The most recent wave low dipped below the 1.1210 area but the market has since moved back up from the zone as some bulls stepped in.
The daily chart looks like it is making a topping pattern and could pullback in the near term. The psychological 1.12 level could provide some support so the bears will need to take out that zone. As in any case. looking at the lower timeframe the market looks like it might push higher first before taking a run at lower levels and attemting to break 1.12.
On the technical side, the MACD histogram has just turned over to the downside and printed red. As you can see from the chart on the left the histogram has broken lower already but there is a little divergence forming. The Relative Strength Index (RSI) is near the oversold level on the hourly and pulling away from overbought on the daily. This combination could suit the short-sellers as they could find another entry when the RSI pulls up slightly.
Additional levels