1 Sep 2020
GBP/JPY Price Analysis: Looks south on the negative divergence of key indicators
- GBP/JPY is sidelined in Asia near 141.45 versus, having faced rejection at 142.00 on Monday.
- Bearish divergences of key 4-hour chart indicators show scope for a deeper pullback.
GBP/JPY is trading mostly unchanged on the day near 141.45 at press time.
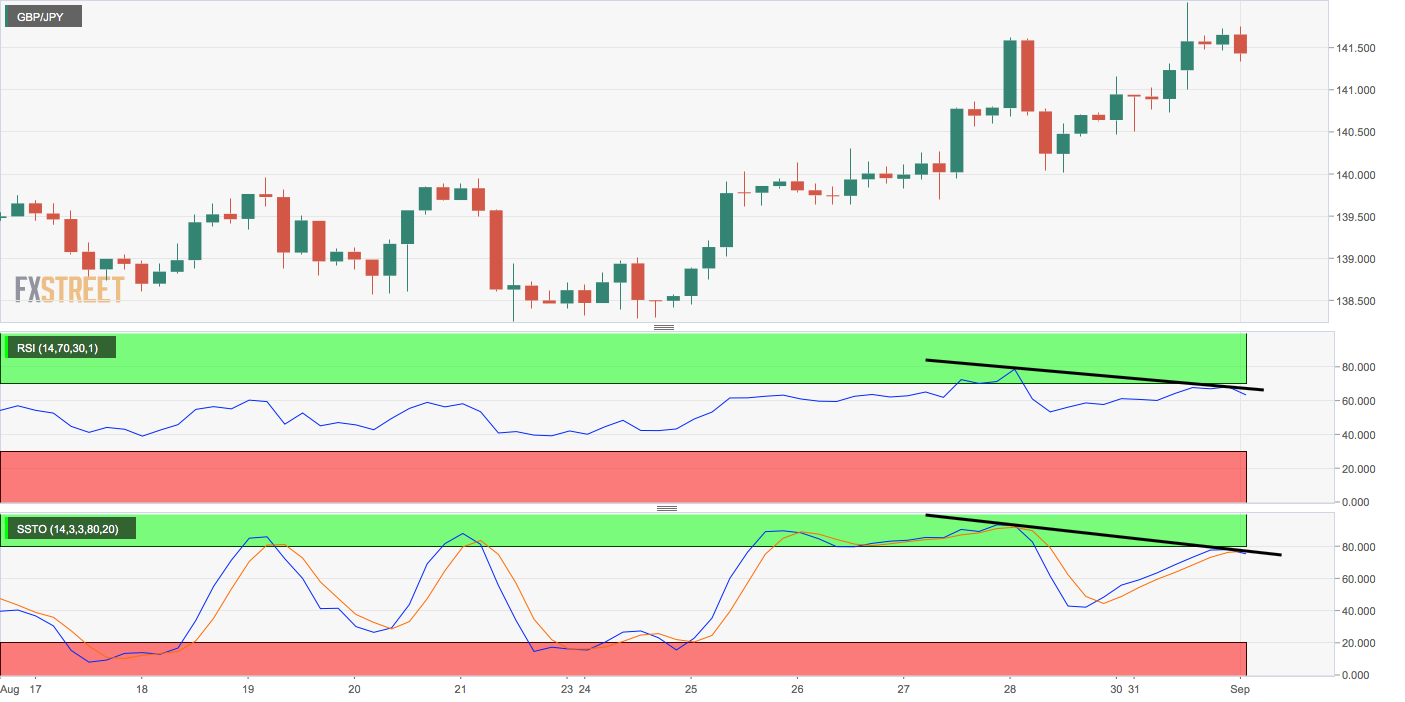
The 4-hour chart shows a bearish divergence of the relative strength index. A bearish divergence occurs when the indicator charts lower highs, contradicting higher highs on prices and is indicative of uptrend exhaustion.
The slow stochastic indicator on the 4-hour chart has also diverged in favor of the bears.
As such, the pair could witness a pullback to the psychological support of 141.00, which, if violated, would shift the focus to the 10-day simple moving average, currently at 139.97. On the higher side, key levels to watch out for are 141.75 (Asian session high) and 142.00.
4-hour chart
Trend: Pullback likely
Technical levels