GBP/USD Price Analysis: Bounces off 200-HMA inside short-term rising channel
- GBP/USD fails to extend Friday’s losses while staying beyond 1.2900 mark.
- Normal RSI, bullish chart pattern offer additional clues for the bulls to watch.
- Sellers may eye the monthly low on conquering the channel’s support.
GBP/USD print mild gains around 1.2930 during the initial Asian trading on Monday. The Cable recently picked up bids after taking a U-turn from 200-HMA. While considering the normal RSI conditions and the latest bounce, not to forget a one-week-old ascending trend channel formation, the quote is likely to print further recovery.
In doing so, 1.2945/50 and 1.2975 may offer immediate resistance to the buyers ahead of Friday’s top near the 1.3000 threshold.
During the quote’s run-up beyond 1.3000, 50% Fibonacci retracement of September 04-11 downside, at 1.3040, can become GBP/USD buyers’ favorite ahead of the resistance line of the aforementioned rising channel, currently around 1.3055.
Alternatively, the lower line of the channel, at 1.2900, can add a floor to the pair’s downside below the 200-HMA level of 1.2911.
Though, GBP/USD weakness below 1.2900 may attack the monthly bottom surrounding 1.2765/60.
GBP/USD hourly chart
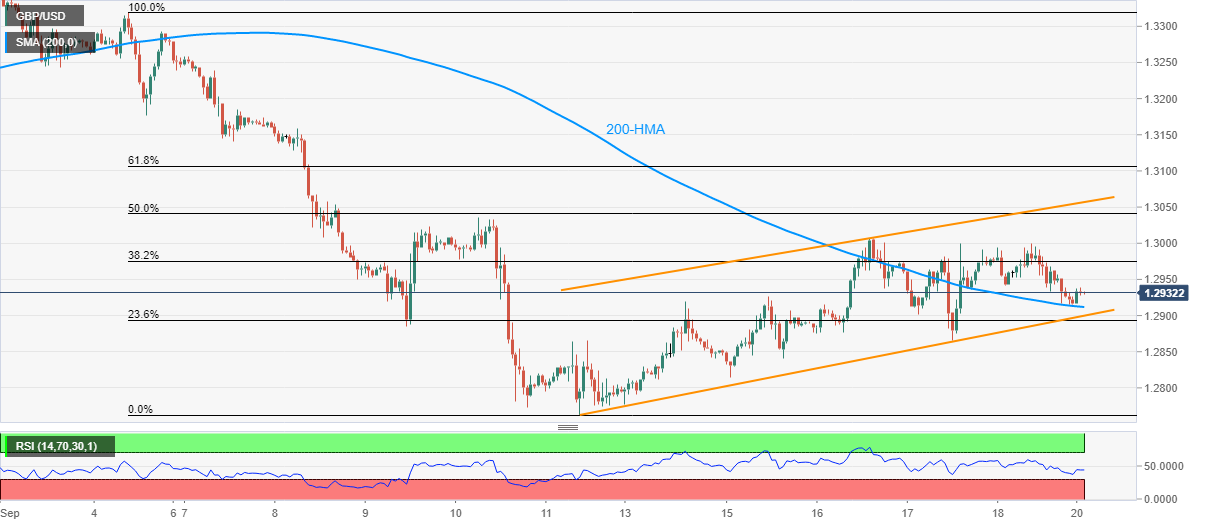
Trend: Further recovery expected