2 Oct 2020
USD/INR Price Analysis: Charts lean bearish
- USD/INR's daily chart shows a bearish continuation pattern.
- Major moving average studies also indicate a negative setup.
USD/INR is currently trading largely unchanged on the day at 73.23.
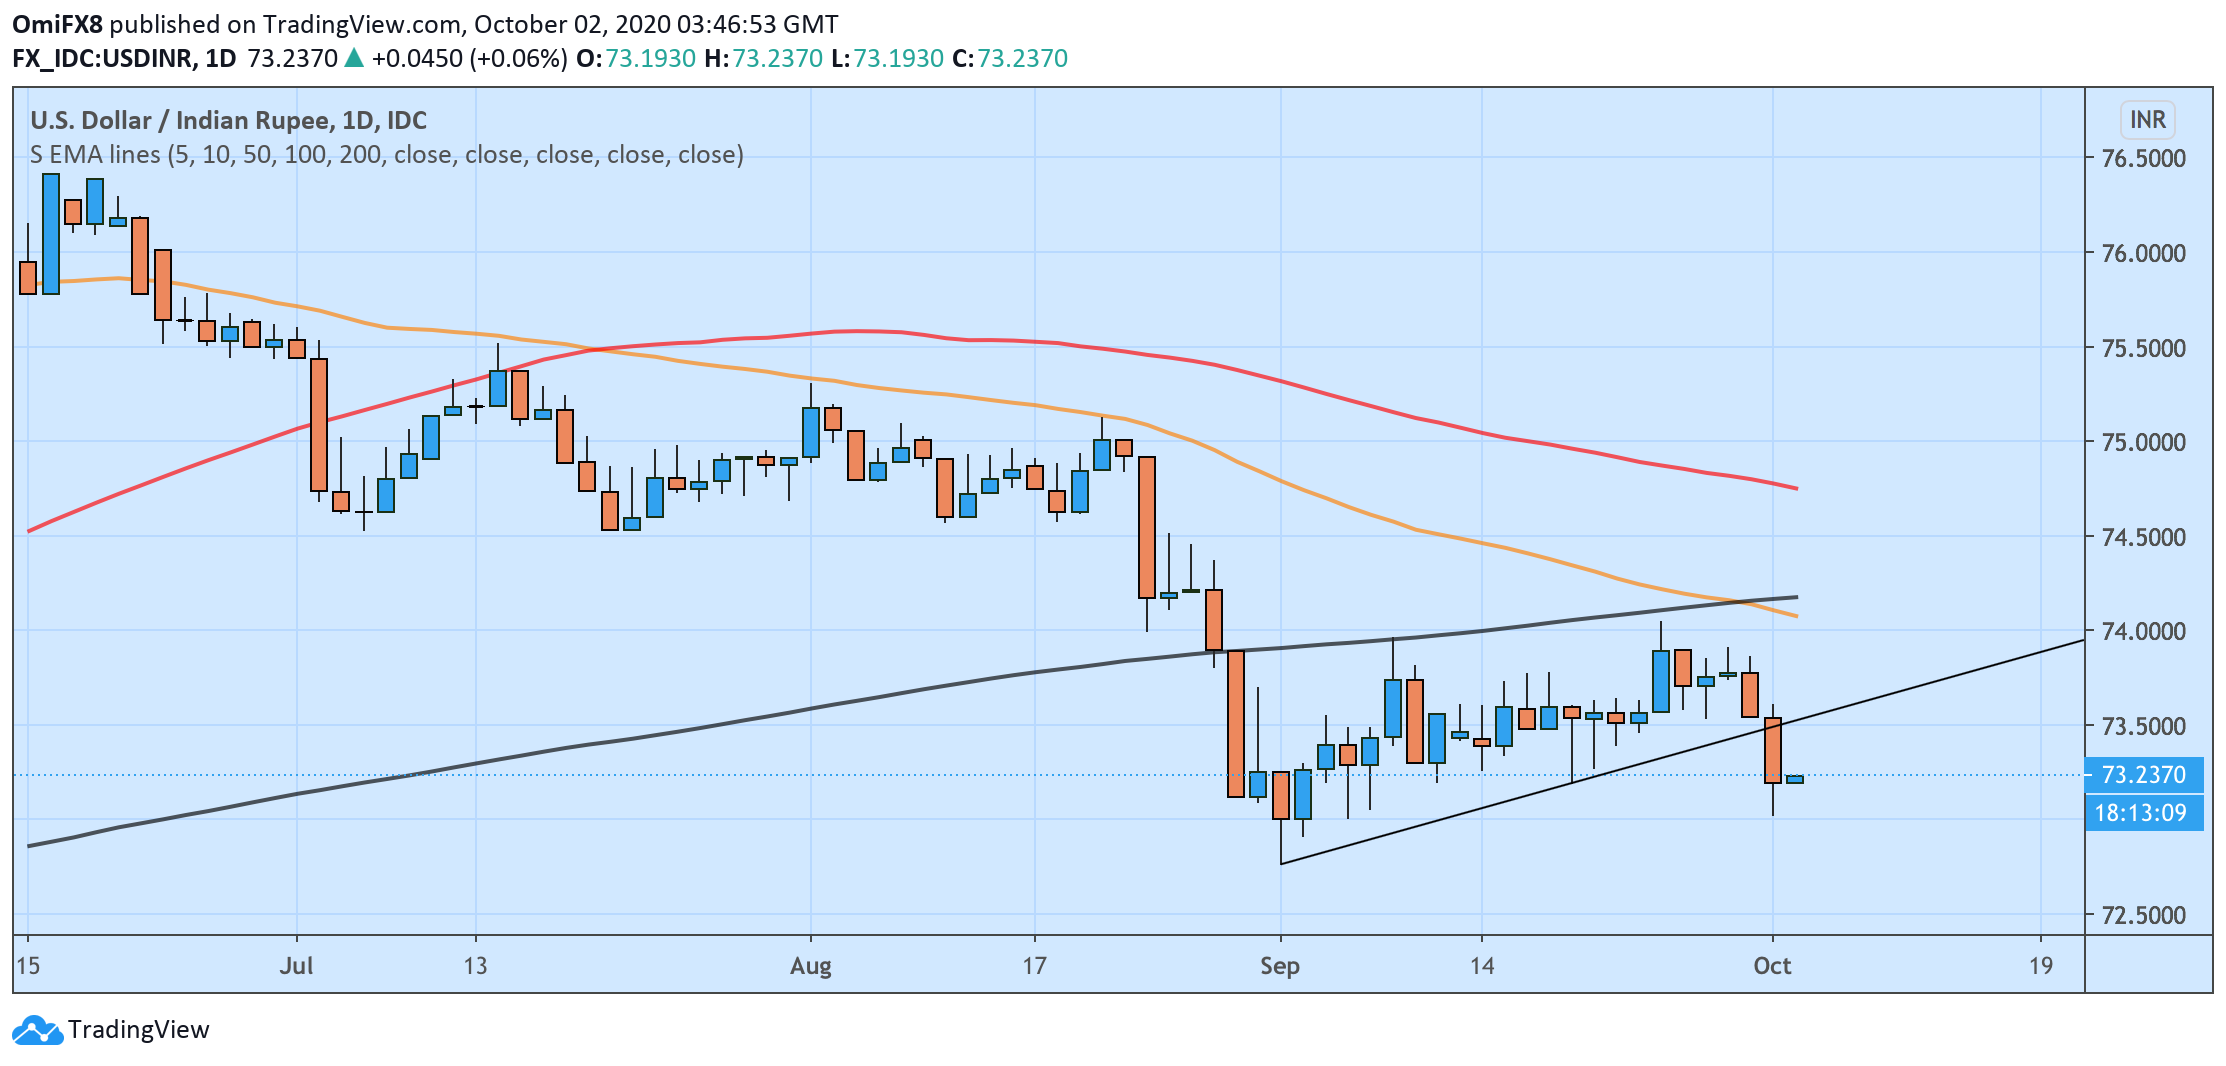
The pair fell by nearly 0.5% on Thursday, violating the trendline connecting Sept. 1 and Sept. 18 low and signaling a resumption of the sell-off from the Aug. 20 high of 75.13.
The breakdown is backed by a bearish crossover of the 100- and 200-day simple moving averages (SMA). The 50-day SMA is also trending south, indicating a bearish setup.
As such, USD/INR could revisit Thursday's low of 73.00. A break below that support would shift the focus to the Sept. 1 low of 72.76.
Alternatively, a close above the lower high of 74.047 (Sept. 24 high) is needed to confirm a bullish reversal.
Daily chart
Trend: Bearish
Technical levels