7 Oct 2020
EUR/USD Price Analysis: Daily chart shows failed breakout
- EUR/USD's daily chart shows a failed bullish breakout.
- The pair risks falling to support below 1.17.
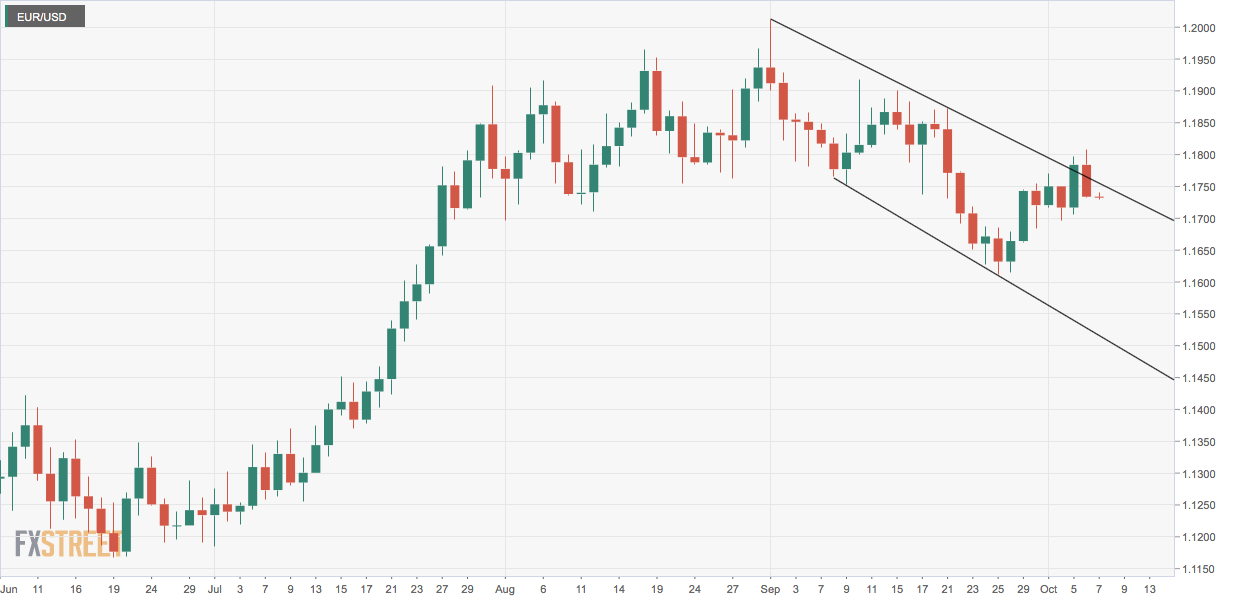
EUR/USD fell 0.40% on Tuesday and closed back inside a falling channel represented by trendlines connecting Sept. 1 and Sept. 21 highs and Sept. 8 and Sept. 25 lows.
Essentially, the bearish channel breakout confirmed on Oct. 5 has been neutralized by Tuesday's decline.
Chart analysts consider failed breakouts as powerful bearish signals. As such, the currency pair now looks south and could test support at 1.1696 (Oct. 2 low).
Tuesday's high of 1.1808 is now the level to beat for the bulls. At press time, the pair is trading in a sideways manner near 1.1733.
Daily chart
Trend: Bearish
Technical levels