12 Oct 2020
EUR/USD Price Analysis: Flashing red despite chart breakout
- EUR/USD's daily chart shows the path of least resistance is to the higher side.
- The shared curency drops on renewed coronavirus concerns.
EUR/USD is trading in the red at press time, despite the bullish daily chart patterns.
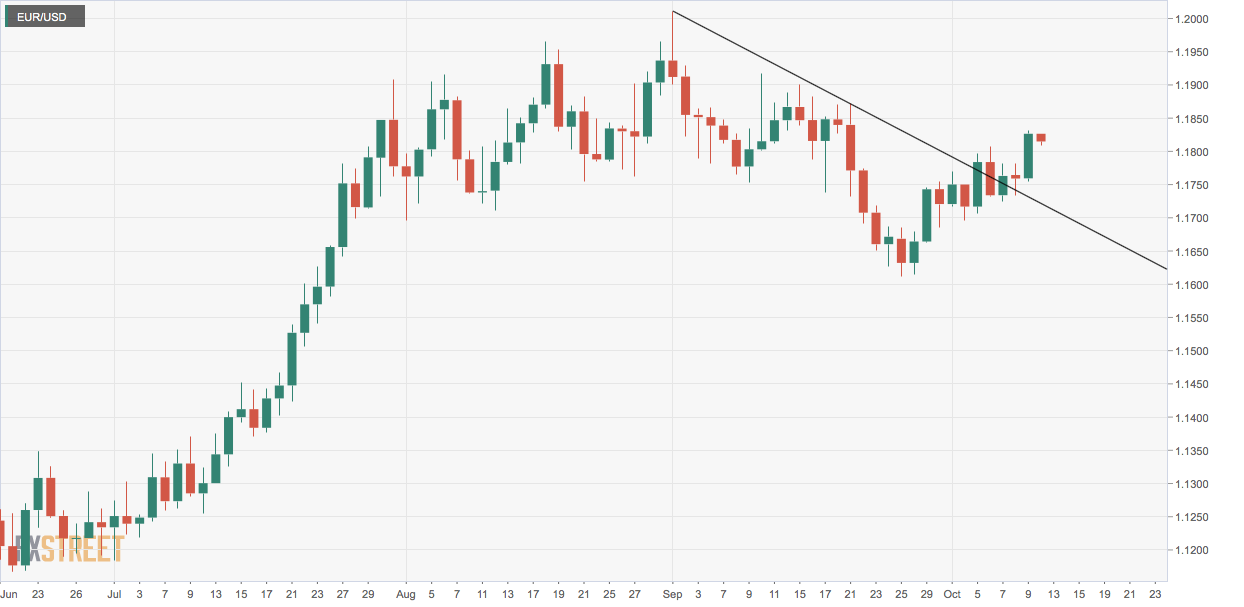
On Friday, EUR/USD jumped 0.61% and formed a bullish marubozu candle, confirming an upside break of the bearish channel represented by trendlines connecting Sept. 1 and Sept. 21 highs and Sept. 8 and Sept. 25 lows.
So far, however, Friday's bullish breakout has failed to entice chart-driven buyers.
The pair is currently hovering near 1.1815, representing a 0.15% loss on the day. The resurgence of coronavirus across the Eurozone seems to be weighing over the shared currency.
That said, the bias will remain bullish while the pair is held above Friday's low of 1.1752.
Daily chart
Trend: Bullish
Technical levels