GBP/USD Price Analysis: Monthly support line backs the bulls above 1.3300
- GBP/USD bounces off two-week-old horizontal line to refresh intraday high.
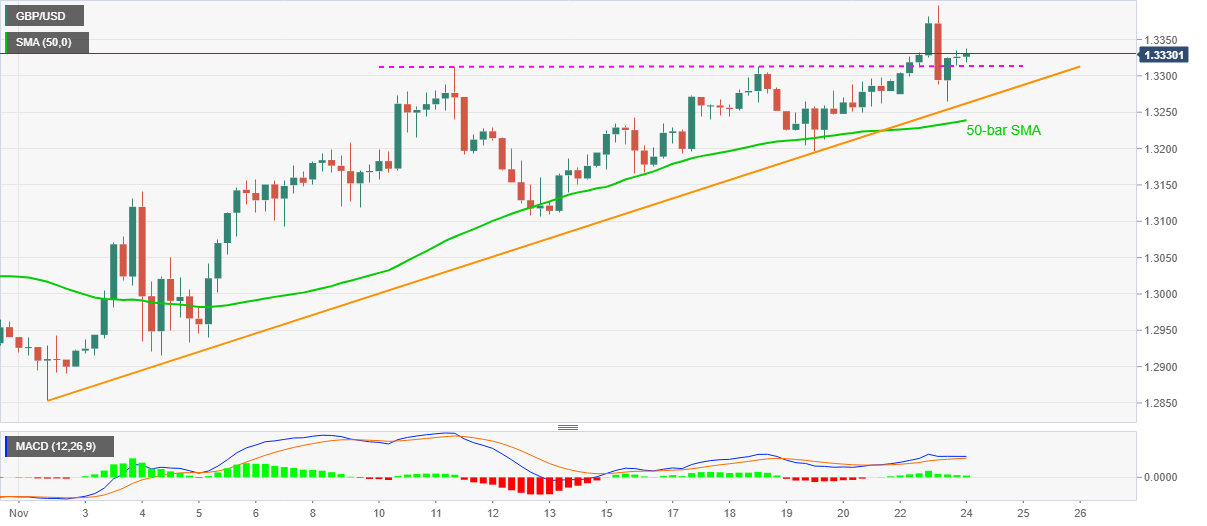
- Bullish MACD, sustained strength above 50-bar SMA favor buyers.
GBP/USD prints mild gains while rising to 1.3330, an intraday high of 1.3338, during early Tuesday. The Cable surged to the fresh high since early September the previous day before stepping back from 1.3397.
However, the following U-turn from a horizontal line connecting highs marked since November 11 joins bullish MACD to favor the pair buyers. Also supporting the odds of GBP/USD upside is the successful trading past-50-bar SMA.
As a result, the 1.3400 round-figure acts as an immediate upside hurdle for the GBP/USD buyers ahead of the yearly peak surrounding 1.3485.
In a case where the quote remains positive beyond 1.3485, the late-2019 top near 1.3515 could return to the charts.
Meanwhile, a downside break of 1.3310 immediate horizontal support will battle the ascending trend line from November 02, at 1.3262 now, before retesting the 50-bar SMA level of 1.3238. However, any more weakness below 1.3238 will direct GBP/USD sellers toward the November 12 low near the 1.3100 round-figure.
GBP/USD four-hour chart
Trend: Bullish