USD/TRY Price Analysis: Slips below 8.0000 as 200-bar SMA guards immediate upside
- USD/TRY extends the previous day’s downward trajectory, wavers around the day’s low off-late.
- MACD flirts with the bears, weekly support line challenge further downside.
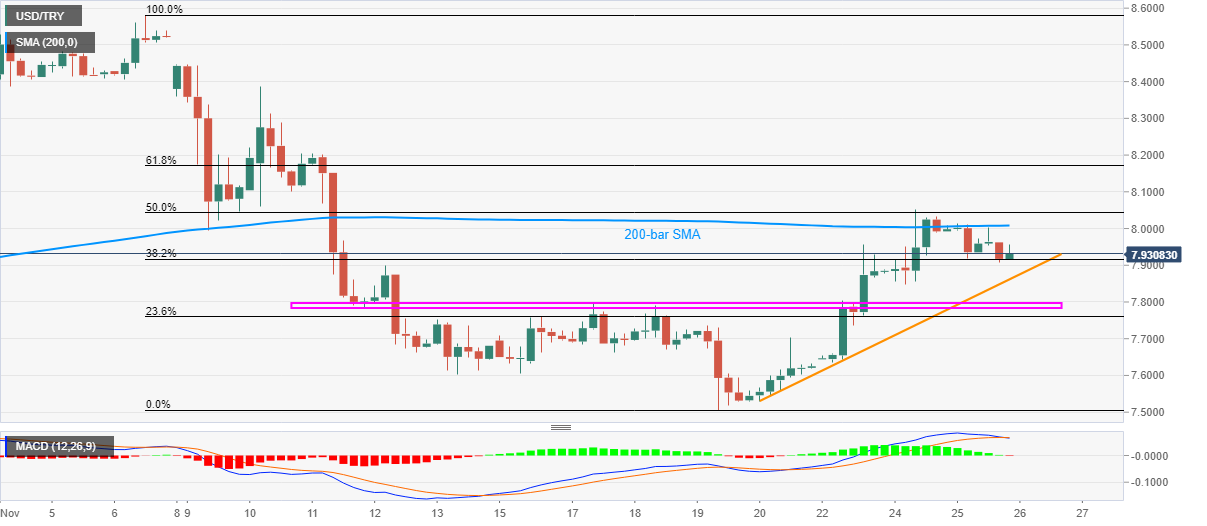
USD/TRY eases to 7.9314, down 0.28% intraday, during Thursday’s Asian session. In doing so, the pair extends Wednesday’s pullback from 200-bar SMA as MACD eases towards the red.
However, an upward sloping trend line from Friday, at 7.8615 now, probes the USD/TRY sellers, for now.
Also acting as the key downside filter is an area including November 11 low and November 17 high around 7.7835/7970.
Alternatively, an upside clearance of 200-bar SMA, currently around 8.0080 needs a clear break above 61.8% Fibonacci retracement of November 06-19 downside, at 8.1705, to recall the USD/TRY buyers.
Following that, the November 10 high of 8.3875 will act as an intermediate halt before directing the bulls to the monthly high near 8.5815.
USD/TRY four-hour chart
Trend: Further weakness expected