WTI Price Analysis: Bulls eye $48.00, recovery moves need validation from 200-HMA
- WTI keeps bounce off $47.25, regains 61.8% above Fibonacci retracement.
- Recovering RSI, break of immediate resistance favor oil buyers.
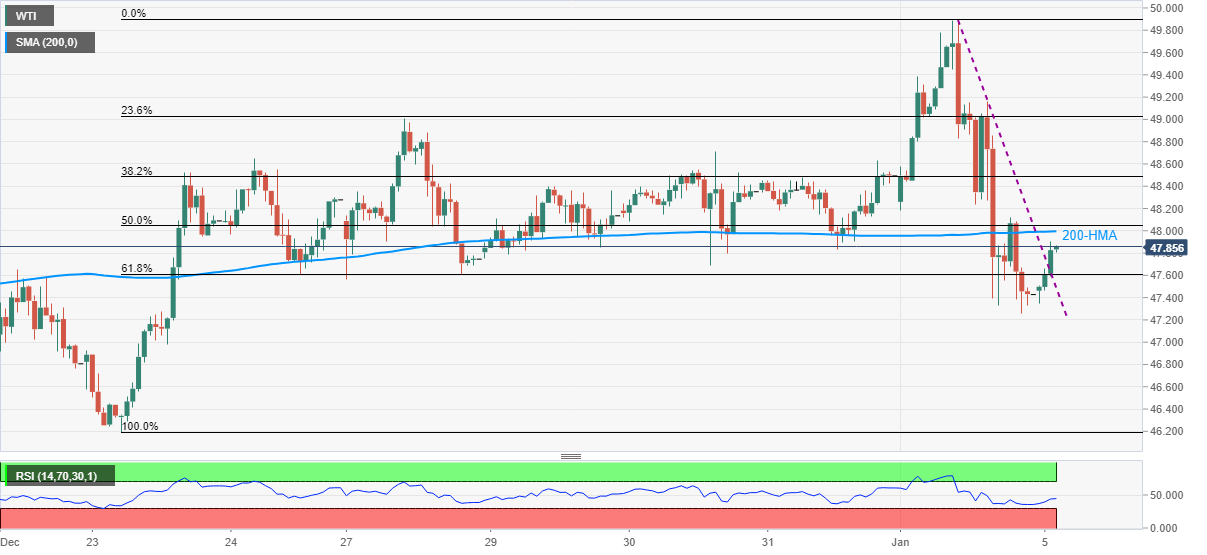
WTI recovers Monday’s losses while picking up the bids around $47.85, up 0.86% intraday, during Tuesday’s Asian session. In doing so, the oil benchmark bounces back beyond the 61.8% Fibonacci retracement of December 23 to January 04 upside while also breaking a downward sloping trend line from the previous day.
Given the RSI recovery backing the upside signals stated above, WTI is likely to overcome the immediate hurdle of 200-HMA, currently near $48.00.
Though, any further upside moves need clear trading beyond December 28 top of $29.00 to target the $50.00 threshold.
Meanwhile, 61.8% Fibonacci retracement near $47.60, the previous resistance line, now support around $47.50 and Monday’s low of $47.25 can entertain short-term sellers during the fresh declines.
Though, November high joins late-December lows near $46.30/20 to challenge WTI’s downside past-$47.25.
WTI hourly chart
Trend: Pullback expected