NZD/USD Price Analysis: Weekly resistance line probes 200-HMA breakout above 0.7200
- NZD/USD fades the previous day’s recovery moves after probing the weekly top.
- RSI, MACD look to ease upside bias, sellers can eye 0.7200 below the key HMA.
- Upbeat fundamentals from New Zealand, broad US dollar weakness favor the bulls.
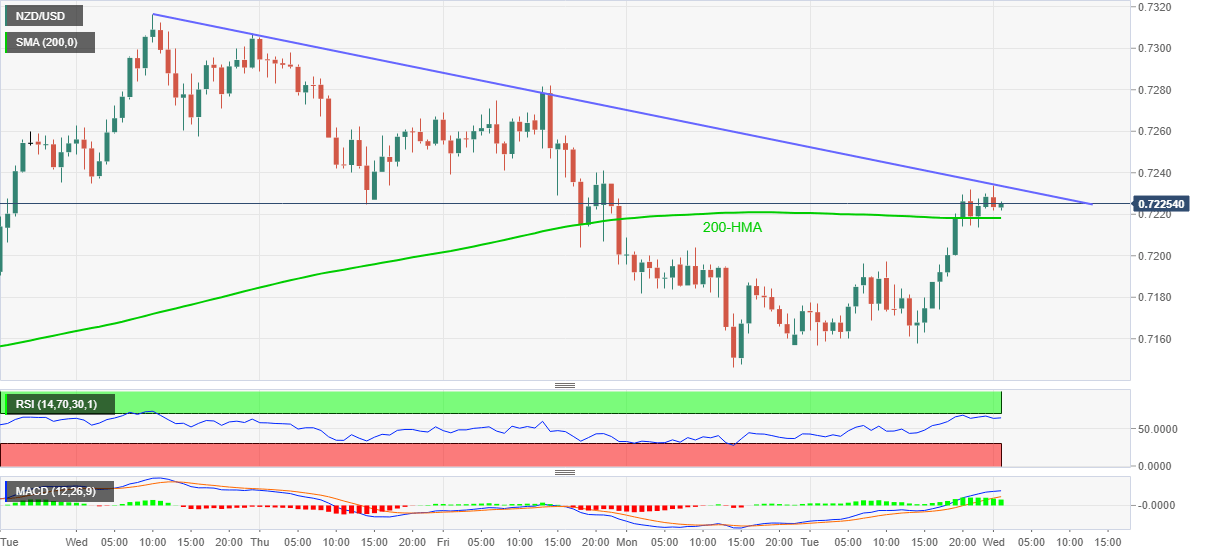
Having recently probed the weekly high near 0.7240, NZD/USD recedes to 0.7224 during Wednesday’s Asian trading. In doing so, the kiwi pair steps back from a falling trend line from December 06 while also keeping the upside break of 200-HMA, flashed the previous day.
New Zealand’s upbeat fundamentals, coupled with the US dollar index (DXY) weakness, join the sustained break of 200-HMA to keep NZD/USD buyers hopeful.
As a result, a short-term falling trend line from January 06, at 0.7233 now, is likely to be breached soon, which in turn poses threats to Friday’s top near 0.7280 and the 0.7300 round-figure.
During the quote’s sustained trading above the 0.7300 threshold, the multi-month high flashed early in January around 0.7320 and the March 2018 peak surrounding 0.7400 will be on the NZD/USD bull’s radar.
Meanwhile, a downside break below the 200-HMA level of 0.7218 will eye for the 0.7200 psychological support before challenging the monthly bottom surrounding 0.7145.
However, NZD/USD bears’ dominance past-0.7145 will eye for the previous month’s low near the 0.7000 level.
NZD/USD hourly chart
Trend: Bullish