Gold Price Analysis: XAU/USD could stretch lower with a break below $1,816
- XAU/USD is fluctuating in a tight range on Tuesday.
- Near-term outlook could turn bearish with a break below $1,810.
- Key resistance seems to have formed around $1,835.
The XAU/USD pair closed the first day of the week in the negative territory and seems to have gone into a consolidation phase on Tuesday. As of writing, the pair was up 0.15% on the day at $1,821.
Gold technical outlook
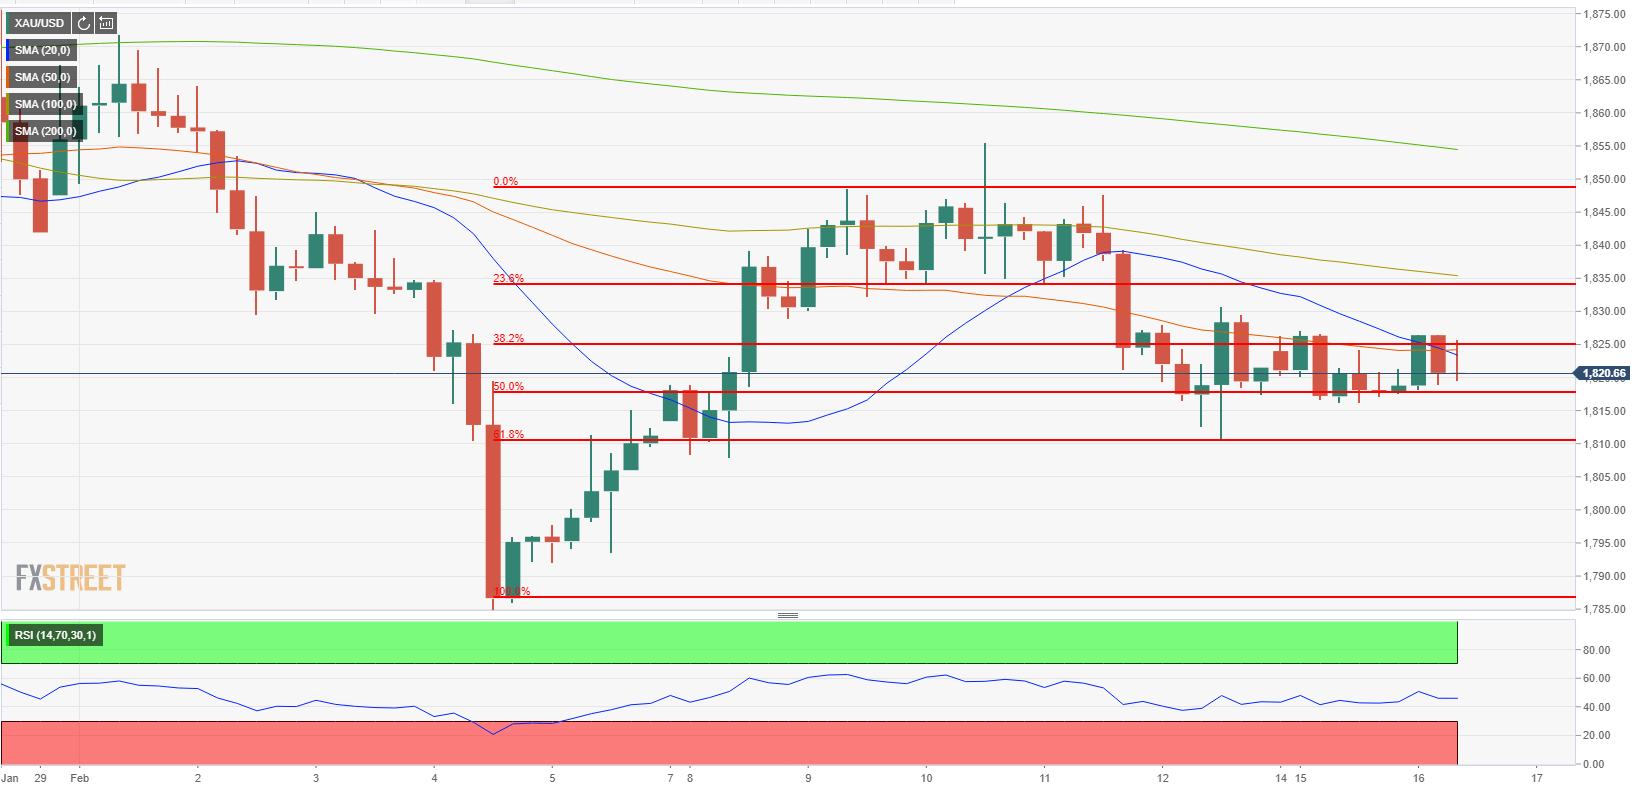
On the four-hour chart, the Relative Strength Index (RSI) indicator is moving sideways around 50, confirming XAU/USD's indecisiveness in the near-term. Additionally, the pair is fluctuating between the Fibonacci 38.2% and 50% retracement levels of the six-day-long uptrend witnessed earlier in the month.
On the downside, the initial support aligns at $1,816 (Fibonacci 50% retracement) ahead of $1,810 (Feb. 12 low/Fibonacci %61.8 retracement). With a break below the latter, XAU/USD could target $1,800 (psychological level).
The initial resistance could be seen at $1,825 (Fibonacci 38.2% retracement). Above that level, the 100-SMA forms the next hurdle at $1,835, which is also reinforced by the Fibonacci 23.6% retracement.
Gold 4-hour chart
Additional levels to watch for