USD/CAD Price Analysis: Jumps to fresh session tops, bulls eyeing 1.2700 mark
- USD/CAD staged a solid intraday bounce from the vicinity of the 1.2700 mark.
- Resurgent USD demand, a pullback in oil prices prompted some short-covering.
- Mixed technical set-up warrants some caution for aggressive bullish traders.
The USD/CAD pair caught some aggressive bids during the early North American session and jumped to fresh daily tops, around the 1.2685 regions in the last hour.
A sudden pickup in the US dollar demand – supported by the ongoing upsurge in the US Treasury bond yields – was seen as a key factor lending some support to the USD/CAD pair. Apart from this, a modest pullback in crude oil prices undermined the loonie and remained supportive of the solid intraday rebound from the vicinity of the 1.2600 mark, or multi-week lows touched earlier this Tuesday.
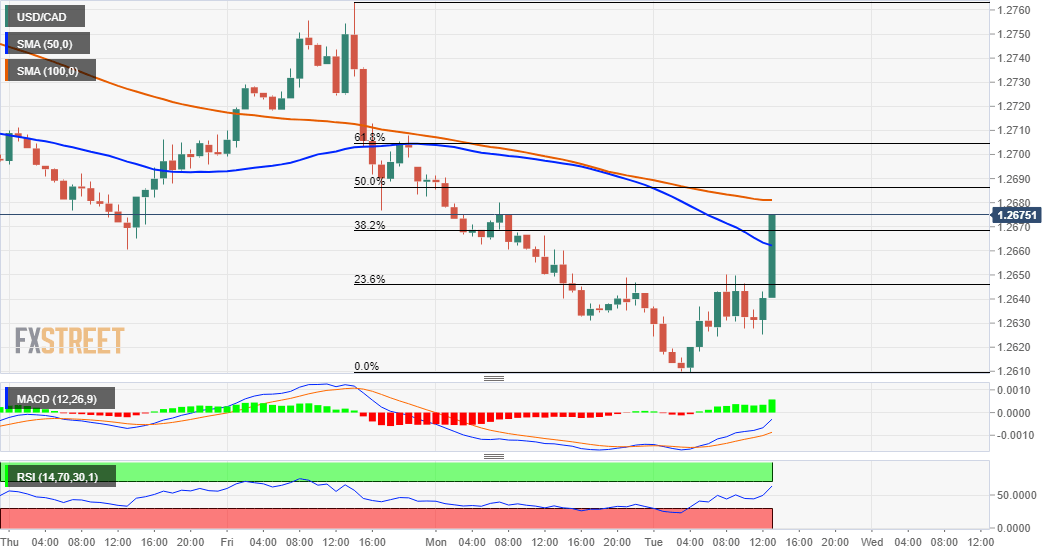
From a technical perspective, sustained strength above the 23.6% Fibonacci level of the 1.2763-1.2610 recent leg down was seen as a key trigger for intraday bullish traders. Some follow-through buying beyond 50-hour SMA and the 38.2% Fibo. level might have set the stage for additional gains. Hence, a subsequent move towards 50% Fibo. level, around the 1.2700 mark, looks a distinct possibility.
Meanwhile, technical indicators on the 1-hourly chart have been gaining positive traction but are yet to confirm a bullish bias on 4-hourly/daily charts. This, in turn, warrants some caution for bullish traders and before positioning for any further near-term appreciating move.
On the flip side, the 23.6% Fibo. level, around the 1.2645 region, now seems to protect the immediate downside. A convincing break below will negate any intraday positive outlook and turn the USD/CAD pair vulnerable. The 1.2610 area (daily swing lows) will be next relevant target on the downside ahead of multi-year lows, around the 1.2590 region touched on January 21.
USD/CAD 1-hourly chart
Technical levels to watch