US Dollar Index turns positive above 90.50
- DXY reverses the initial drop and regains the 90.50 area.
- US Empire State index surprised to the upside in February.
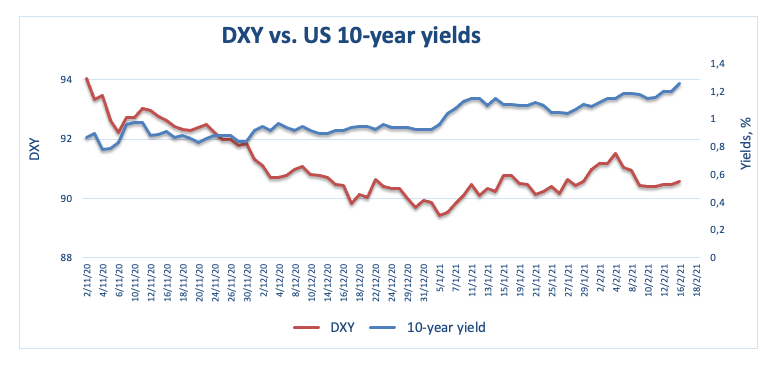
- Higher yields help in the dollar’s recovery on Tuesday.
The US Dollar Index (DXY), which gauges the greenback vs. a bundle of its main competitors, now regains the positive ground and retakes 90.50 and beyond.
US Dollar Index stronger on higher yields
The index leaves behind the initial pessimism and regains the smile on the back of the persistent move higher in US yields. Indeed, yields of the key US 10-year note climb further and record new yearly tops above 1.26%, area last visited in March 2020.
In the US data space, the NY Empire State Index came in above estimates at 12.10 in February ahead of December TIC Flows and the speech by FOMC’s M.Bowman (permanent voter, centrist).
What to look for around USD
The corrective downside in the index appears to have met a decent support near the 90.30/20 band recently. The price action in the dollar seems to have decoupled somewhat from the performance of US yields in past days, while the continuation of the downtrend in the dollar looks the most likely scenario for the time being against the backdrop of the fragile outlook for the currency in the medium/longer-term. In the meantime, the current massive monetary/fiscal stimulus in the US economy, the “lower for longer” stance from the Fed and prospects of a strong recovery in the global economy are forecast to keep any serious bullish attempts in the buck well contained.
Key events in the US this week: January’s Retail Sales, Industrial Production and the FOMC Minutes (Wednesday). Weekly Initial Claims and the Philly Fed Index are due on Thursday ahead of flash PMIs (Friday).
Eminent issues on the back boiler: US-China trade conflict under the Biden’s administration. Tapering speculation vs. economic recovery. US real interest rates vs. Europe. Could US fiscal stimulus lead to overheating? Future of the Republican party post-Trump acquittal.
US Dollar Index relevant levels
At the moment, the index is losing 0.19% at 90.31 and faces initial support at 90.22 (weekly low Feb.16) followed by 90.04 (weekly low Jan.21) and then 89.20 (2021 low Jan.6). On the other hand, a breakout of 91.58 (10-day SMA) would open the door to 91.60 (2021 high Feb.5) and finally 92.46 (23.6% Fibo of the 2020-2021 drop).