GBP/USD Price Analysis: Bullish impulse set to cross 1.4000 inside short-term rising channel
- GBP/USD bulls catch breather around fresh multi-month high.
- Sustained break of the mid-month top, bullish chart pattern favor buyers.
- 50-bar SMA adds to the downside filters even if overbought RSI plays its role.
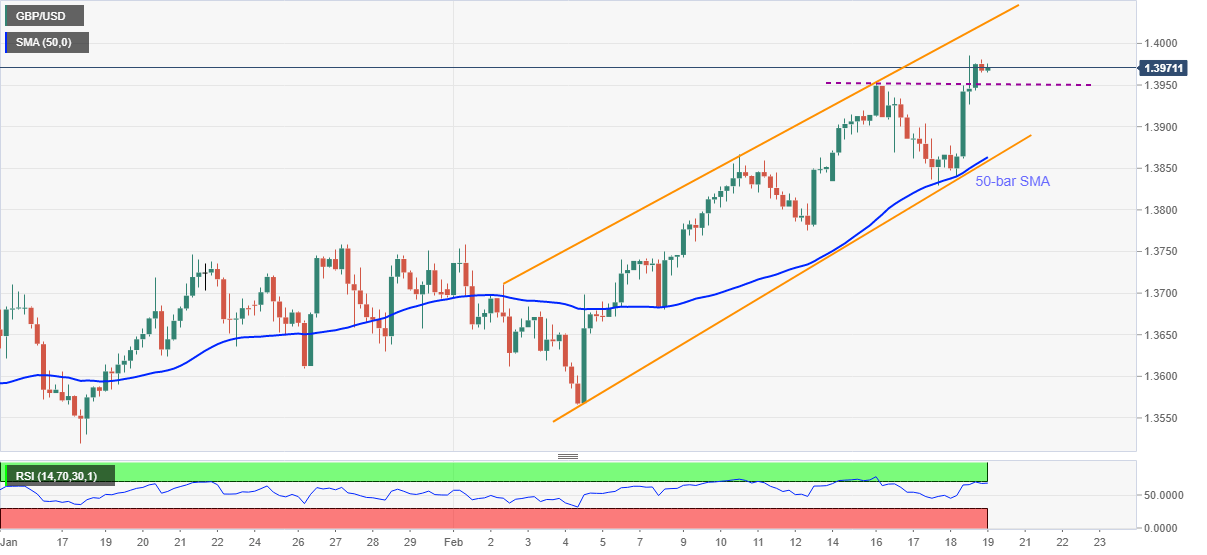
GBP/USD eases from the 34-month high marked the previous day while taking rounds to 1.3970, down 0.05% intraday, during Friday’s Asian session.
Although overbought RSI conditions favor the quote’s pullback moves, sterling’s ability to keep the previous day’s breakout of February 16 top joins the successful trading above 50-bar SMA, also keeping the 13-day-old rising channel, favor the bulls.
As a result, any pullback beyond the stated SMA level and the channel’s support line, around 1.3860, becomes irrelevant for the bears. However, a downside break of 1.3950 can entertain short-term sellers of the GBP/USD.
In a case where the cable drops below 1.3860, the late-January tops surrounding 1.3760-55 will be in the spotlight.
On the flip side, the latest high of 1.3986 can entertain the bulls before directing them towards the 1.4000 threshold.
During the quote’s further upside past-1.4000, the stated channel’s resistance line near 1.4030 will be the key to watch.
GBP/USD four-hour chart
Trend: Bullish