WTI Price Analysis: 10-day EMA renews bullish bets targeting $60.00
- WTI snaps two-day losing streak, wavers near intraday top off-late.
- RSI conditions suggesting intermediate pullback around short-term resistance line.
- Sellers need to break ascending trend line from November 02 for confirmation.
Following its quick bounce off WTI $58.80, WTI prints 1.3% intraday gains while taking rounds to a choppy range above $59.50, currently near $59.80, during early Monday. In doing so, the energy benchmark rises for the first time in three days while bouncing off 10-day SMA.
Given the quote’s sustained U-turn from short-term key SMA, oil buyers may hit the $60.00 threshold as an immediate target ahead of challenging the recently flashed multi-month top of $62.25.
It should, however, be noted that overbought RSI conditions will challenge the WTI bulls beyond $62.25 as an upward sloping trend line from January 13 should trigger pullback moves.
In a case where the barrel of black gold gains past-$62.25, the year 2020 peak surrounding $65.45 will return to the chart.
Alternatively, a downside break of 10-day EMA, at $59.07 now, will have to break below a nearly four-month-old support line, currently around $55.60, to recall the oil sellers.
Following that January’s top near $53.90 should gain the market’s attention.
WTI daily chart
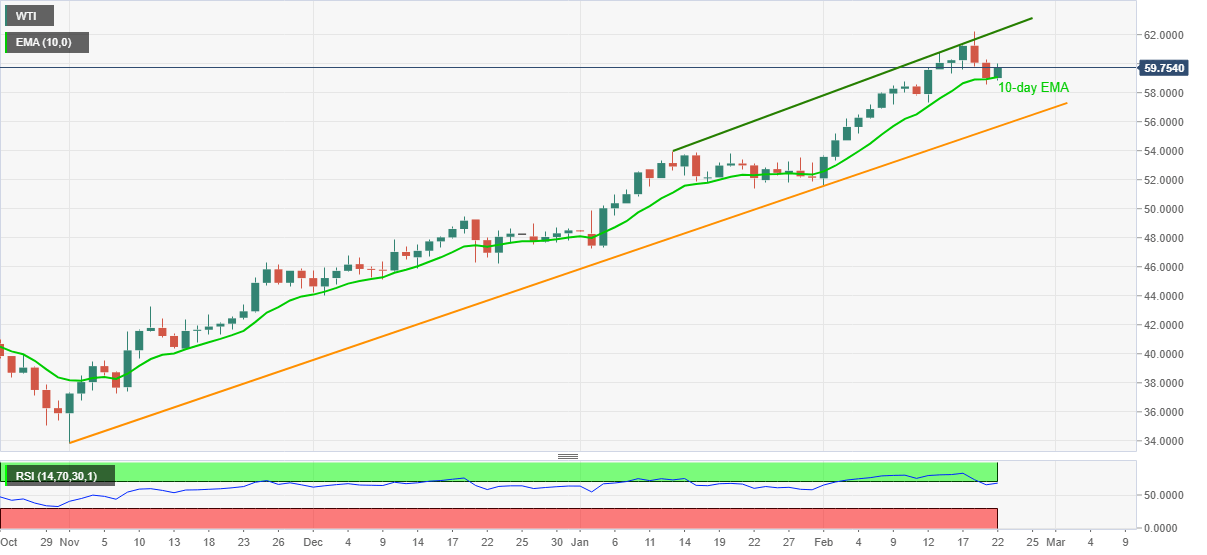
Trend: Bullish