1 Mar 2021
Dollar Index Price Analysis: Bull reversal pattern on the weekly chart
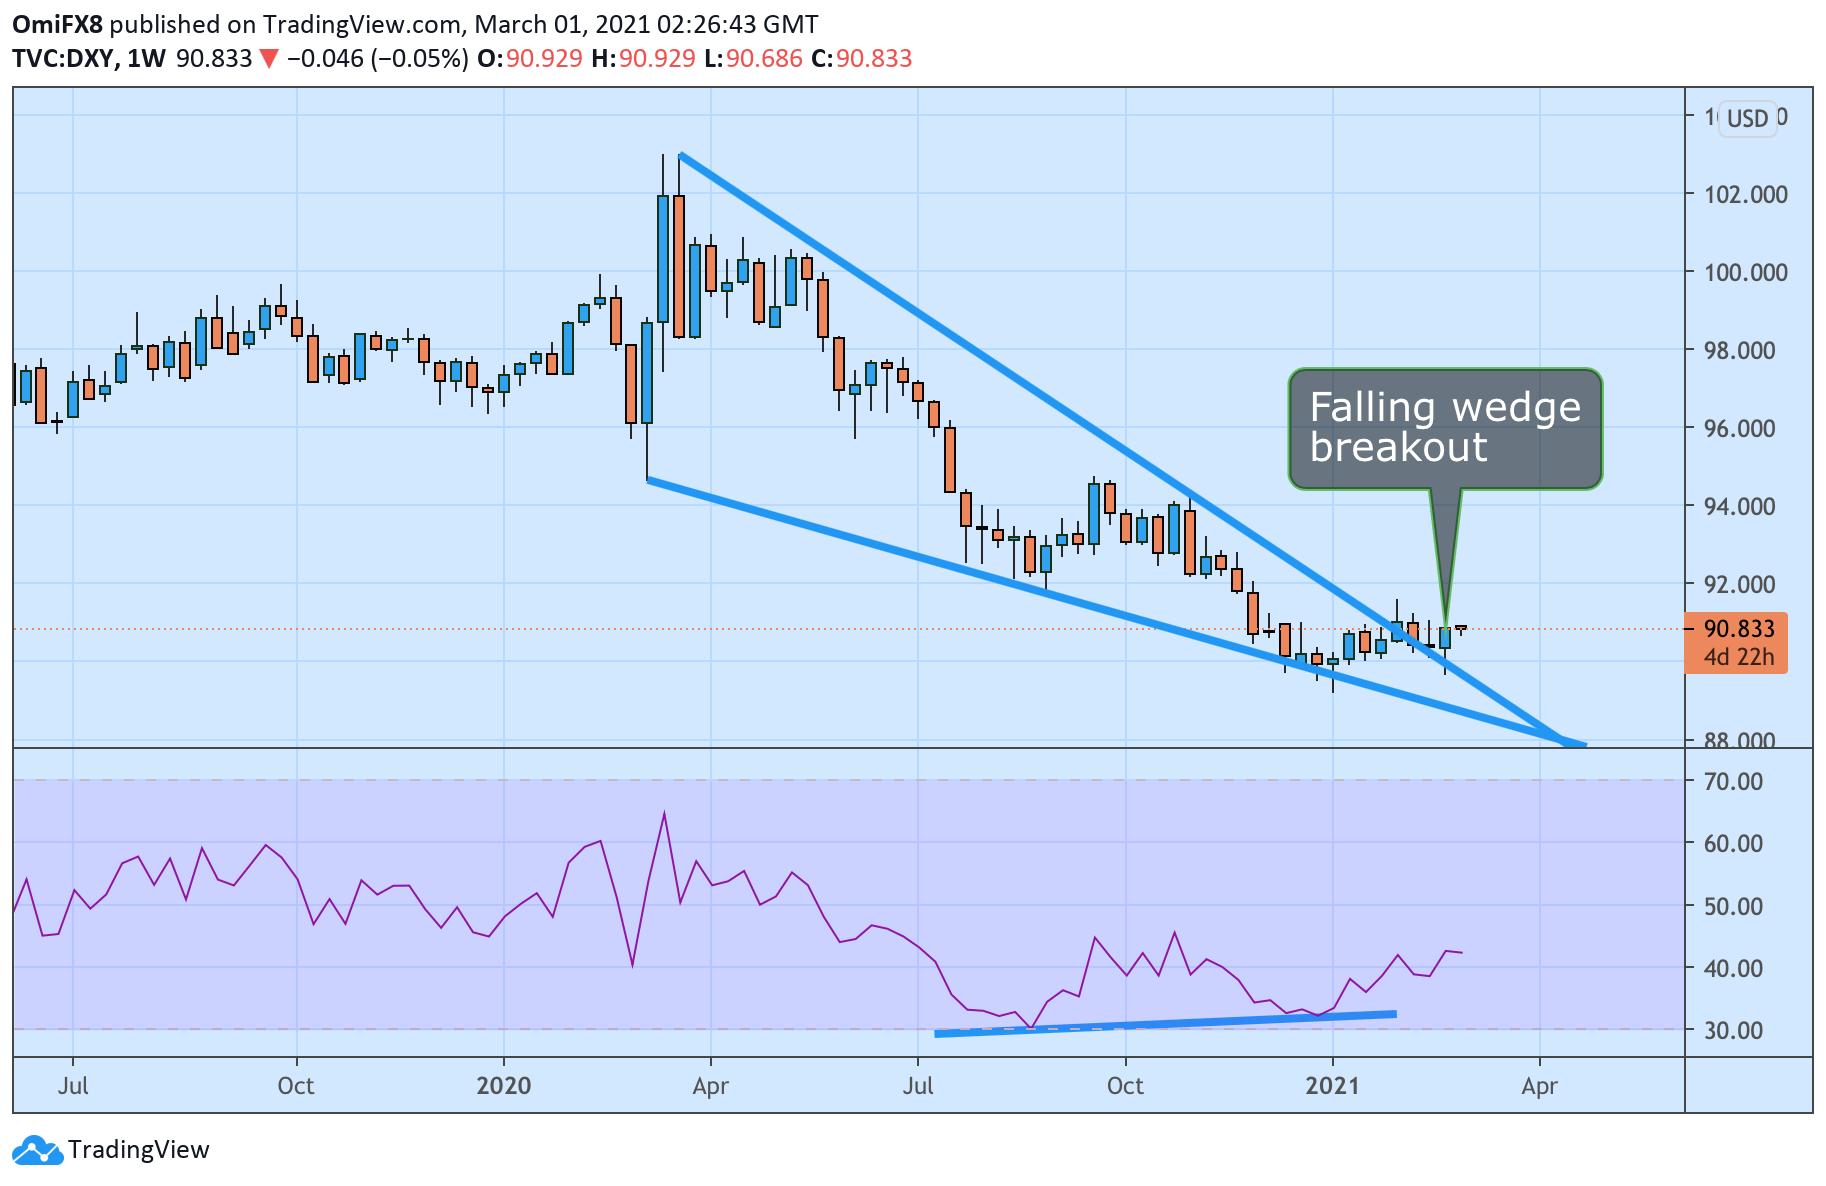
The dollar index (DXY), which tracks the greenback's value against majors, looks north, with the weekly chart showing a falling wedge breakout, a bullish reversal pattern, and a bullish divergence of the Relative Strength Index.
Essentially, the DXY's sell-off from the March 2020 high of 102.99 has ended, and the bulls look to have regained control.
The February high of 91.60 is the immediate resistance, followed by the descending 50-week SMA at 94.21. Acceptance under last week's low of 89.68 would neutralize the immediate bullish bias.
Weekly chart
Trend: Bullish
Technical levels