USD/TRY Price Analysis: Eyes further gains above 7.8000
- USD/TRY stays firm following the heaviest run-up in 31 months.
- Sustained bounce off early-month top, bullish MACD signals back buyers.
- 61.8% Fibonacci retracement levels, November 2020 levels lure bulls.
USD/TRY picks up bids near the intraday high of 7.8450, currently up 0.50% near 7.8390, during early Tuesday. In doing so, the quote justifies its U-turn from March 08 top amid bullish MACD signals.
Given the downbeat signals from Turkey, coupled with the pair’s sustained recovery moves, USD/TRY is up for confronting the 61.8% Fibonacci retracement level of November 2020 to February 2021 downside, around 7.9340.
Though, the quote’s further upside will be challenged by a horizontal area comprising November 2020 levels near 8.0500.
It’s worth mentioning that the quote’s run-up beyond 8.0500 will have to cross the 8.4000 and the recent high near 8.4835 before challenging late-2020 tops surrounding 8.5815.
Alternatively, a downside break of 7.7850 can recall sellers, which in turn highlights a 50% Fibonacci retracement level of 7.7352.
It should, however, be noted that the USD/TRY fall below 7.7352 will be tested by January’s peak and 200-day SMA, respectively around 7.5450 and 7.4515.
USD/TRY daily chart
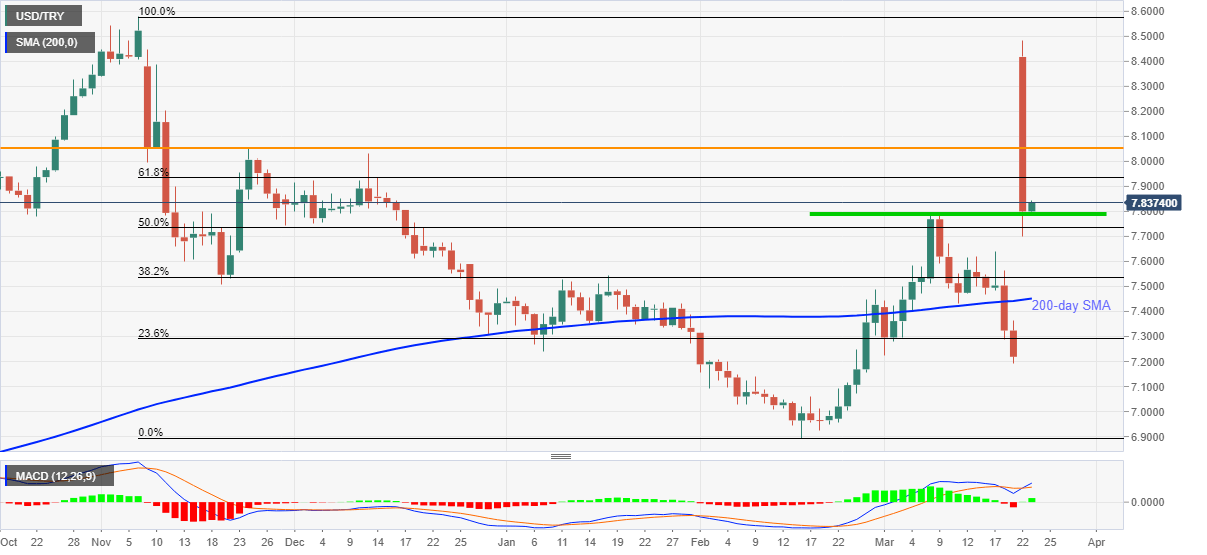
Trend: Bullish