Gold Price Analysis: XAU/USD prints rounding top, sellers eye $1,721 breakdown
- Gold fails to keep Thursday’s bounce, refreshes intraday low.
- Downbeat momentum, extended trading below 200-SMA suggest confirmation of bearish chart pattern is on the way.
- 100-SMA adds to the downside filters, monthly top offers extra resistance.
Gold drops to the fresh intraday low around $1,726, down 0.05% on a day, during early Friday. In doing so, the yellow metal fades the previous day’s corrective pullback while keeping sellers hopeful inside a bearish chart formation.
The commodity’s failures to keep the recovery moves seem to join a downward sloping momentum line and sustained trading below 200-SMA in favoring the bears.
However, a clear downside break below $1,721 becomes necessary as 100-SMA adds to the downside filters.
Following that the $1,700 can offer an intermediate halt before dragging the quote towards the monthly low of around $1,677.
Meanwhile, $1,745-46 and 200-SMA level near $1,756 guard the bullion’s short-term upside ahead of a horizontal line comprising the monthly peak and February 19 low close to $1,760.
It’s worth mentioning that the metal’s ability to cross $1,760 is a golden pass for the bulls as November 2020 lows near $1,765 also challenge the further upside.
Gold four-hour chart
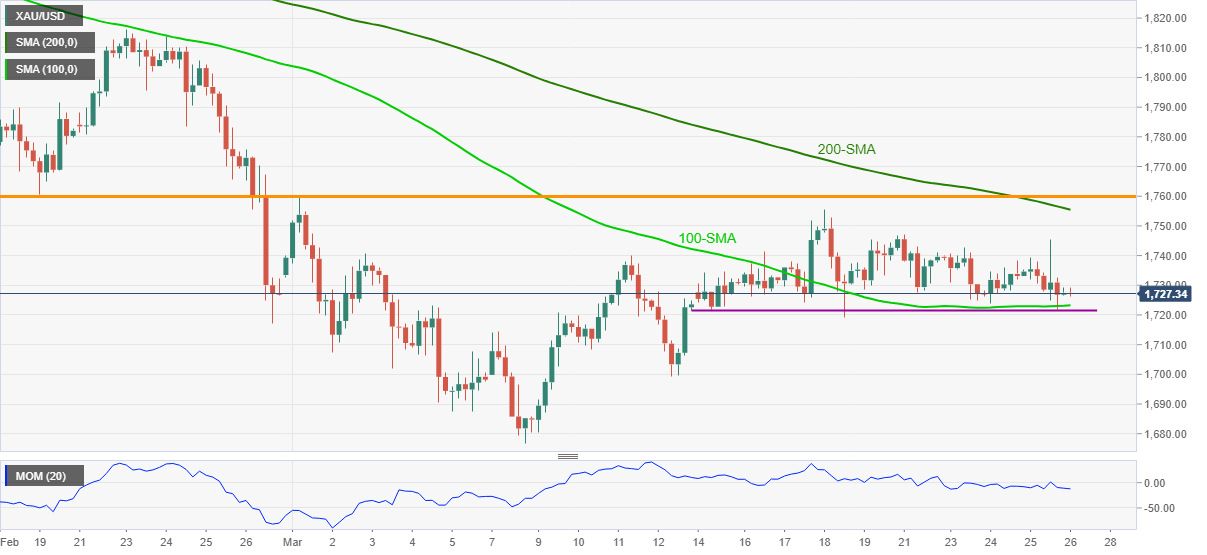
Trend: Further weakness expected