USD/CAD Price Analysis: Bulls keep two-month-old resistance line on radar
- USD/CAD takes the bids near intraday high, keeps bounce off 21-day SMA.
- Normal RSI conditions suggest another attempt to break the key hurdle.
- Bulls can eye monthly top on the successful rise while bears have a bumpy road ahead.
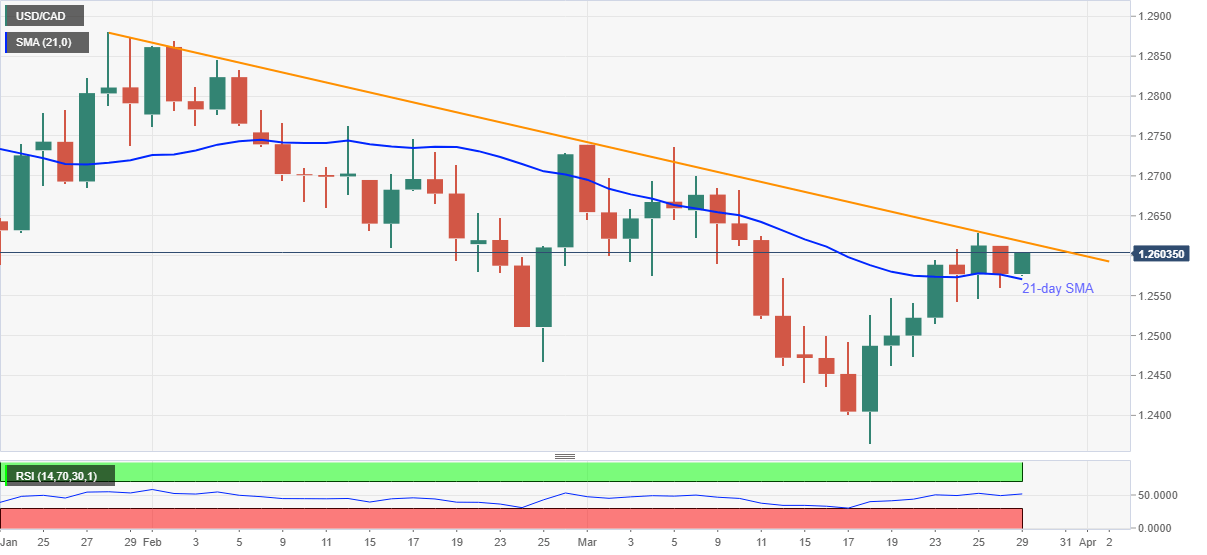
USD/CAD rises to 1.2603, up 0.20% intraday, during Monday’s Asian session. In doing so, the quote keeps last Tuesday’s upside break of 21-day SMA while eyeing a downward sloping trend line from late January.
Considering the strong RSI and the quote’s sustained run-up beyond the short-term SMA, USD/CAD is likely to pierce the stated immediate hurdle around 1.2620.
However, a daily closing beyond 1.2620 becomes necessary for the USD/CAD bulls to challenge the monthly top surrounding 1.2740.
Meanwhile, a downside break of a 21-day SMA level of 1.2570 will have multiple supports around 1.2500, 1.2470 and 1.2400 before the bears attack the monthly low of 1.2364.
Overall, USD/CAD bulls are rolling up their sleeves and a clear break of 1.2620 will be the key to watch.
USD/CAD daily chart
Trend: Bullish