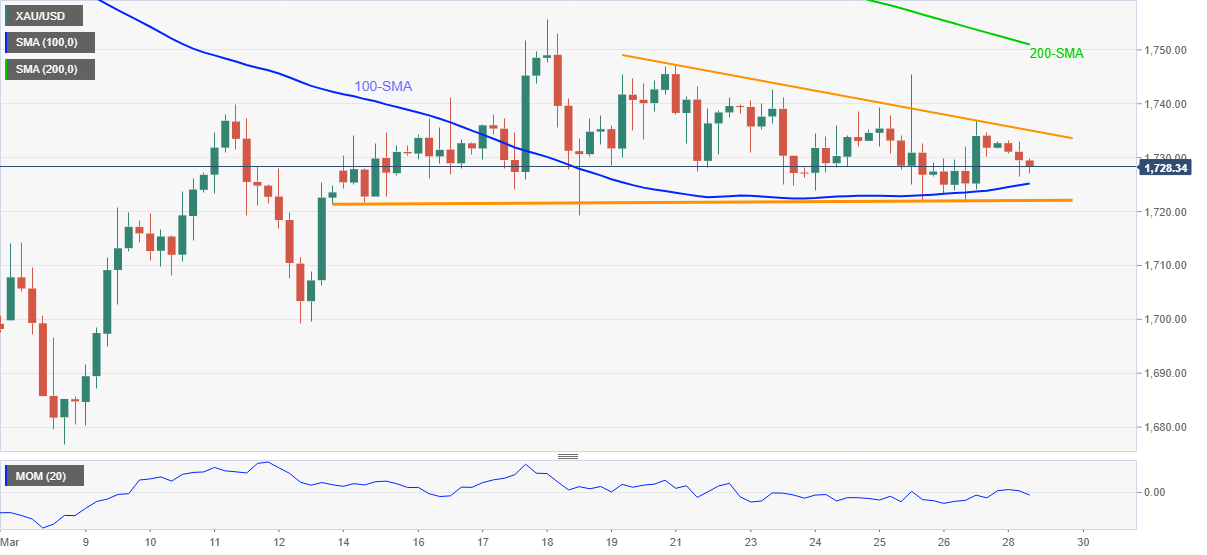
Gold Price Analysis: XAU/USD sellers eye 100-SMA inside immediate falling triangle
- Gold extends pullback from $1,733 towards intraday low.
- Downward sloping momentum line suggests further weakness but triangle formation will test the sellers.
- Bulls are less likely to enter below 200-SMA.
Gold takes offers around $1,727, down 0.32% intraday, while heading into Monday’s European session. In doing so, the yellow metal stays inside a short-term falling triangle bullish chart pattern.
Given the descending Momentum, 100-SMA around $1,725 can offer an intermediate halt during the fall targeting the triangle’s support line close to $1,722.
However, any further downside past-$1,722 becomes less likely and the same may not refrain from challenging the $1,700 if broken.
Alternatively, gold buyers will wait for a clear upside break of the stated triangle’s resistance line, at $1,735 by the press time, to confirm the bullish formation.
While November 2020 lows near $1,765 could lure the bullion buyers past-$1,735, 200-SMA around $1,751 may offer an intermediate halt during the rise.
To sum up, gold is weak but is near to the short-term supports and risks rebound.
Gold four-hour chart
Trend: Pullback expected