Gold Price Analysis: XAU/USD run-up needs validation from $1,735
- Gold registered daily close beyond two-month-old falling trend line.
- Bullish MACD suggests challenges to the immediate hurdle.
- A clear upside break will eye 100-day SMA, bears will have a bumpy road.
Gold’s clear break above a downward sloping trend line from late January keeps bulls hopeful on Good Friday. Also favoring the upside momentum are the MACD signals and the US dollar weakness that keeps the yellow metal above $1,730.
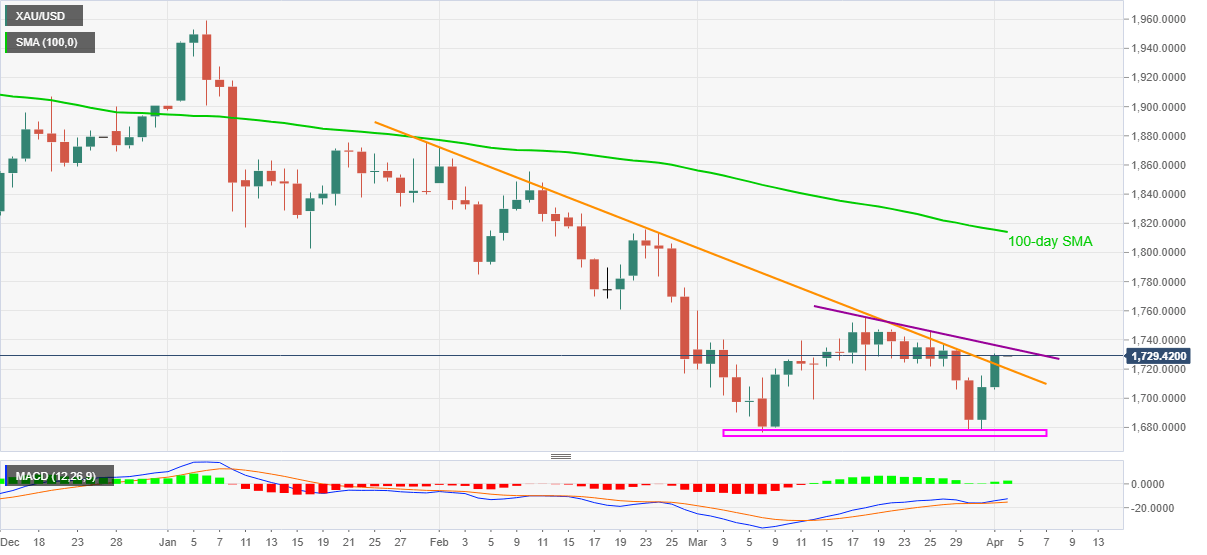
It should, however, be noted that a downward sloping trend line from March 18, currently around $1,735, guards the bullion’s immediate upside, a break of which will direct buyers toward February 19 low near $1,760 and November 2020 bottom surrounding $1,765.
Though, the $1,800 threshold and 100-day SMA level of $1,813 could be ultimate challenges to the gold optimists beyond $1,765.
On the contrary, the metal’s declines below $1,720, comprising the previous resistance line, may catch a breather around the $1,700 round figure.
Should the commodity prices stay weak under $1,700, the double bottom formation near $1,676 will be the key to watch.
Gold daily chart
Trend: Further upside expected