AMC Entertainment Holdings (AMC) forecast: AMC breaks $14.54 resistance, to the moon next resistance
- AMC shares, wowser is all one can say!
- AMC smashes key resistance at $14.54.
- AMC shares surge nearly 20% to close at $16.41.
AMC to the moon might yet come true the way this one is going. Maybe AMC shareholders should petition Richard Branson to bring an AMC logo on the next SPCE flight so it really can go to the moon. The way the shares are trading they just might manage it anyway. Tuesday saw an incredible 20% surge in the shares of the cinema operator. In the process, AMC shares smashed through the key resistance level at $14.54. This level had held the recent rise and looked to be proving difficult to break. Not so anymore and now not much stands in the way of a test of recent highs from the original GameStop frenzy days back in January. The premarket on Wednesday is certainly indicating more to come with AMC trading above $17 early on.
AMC stock forecast
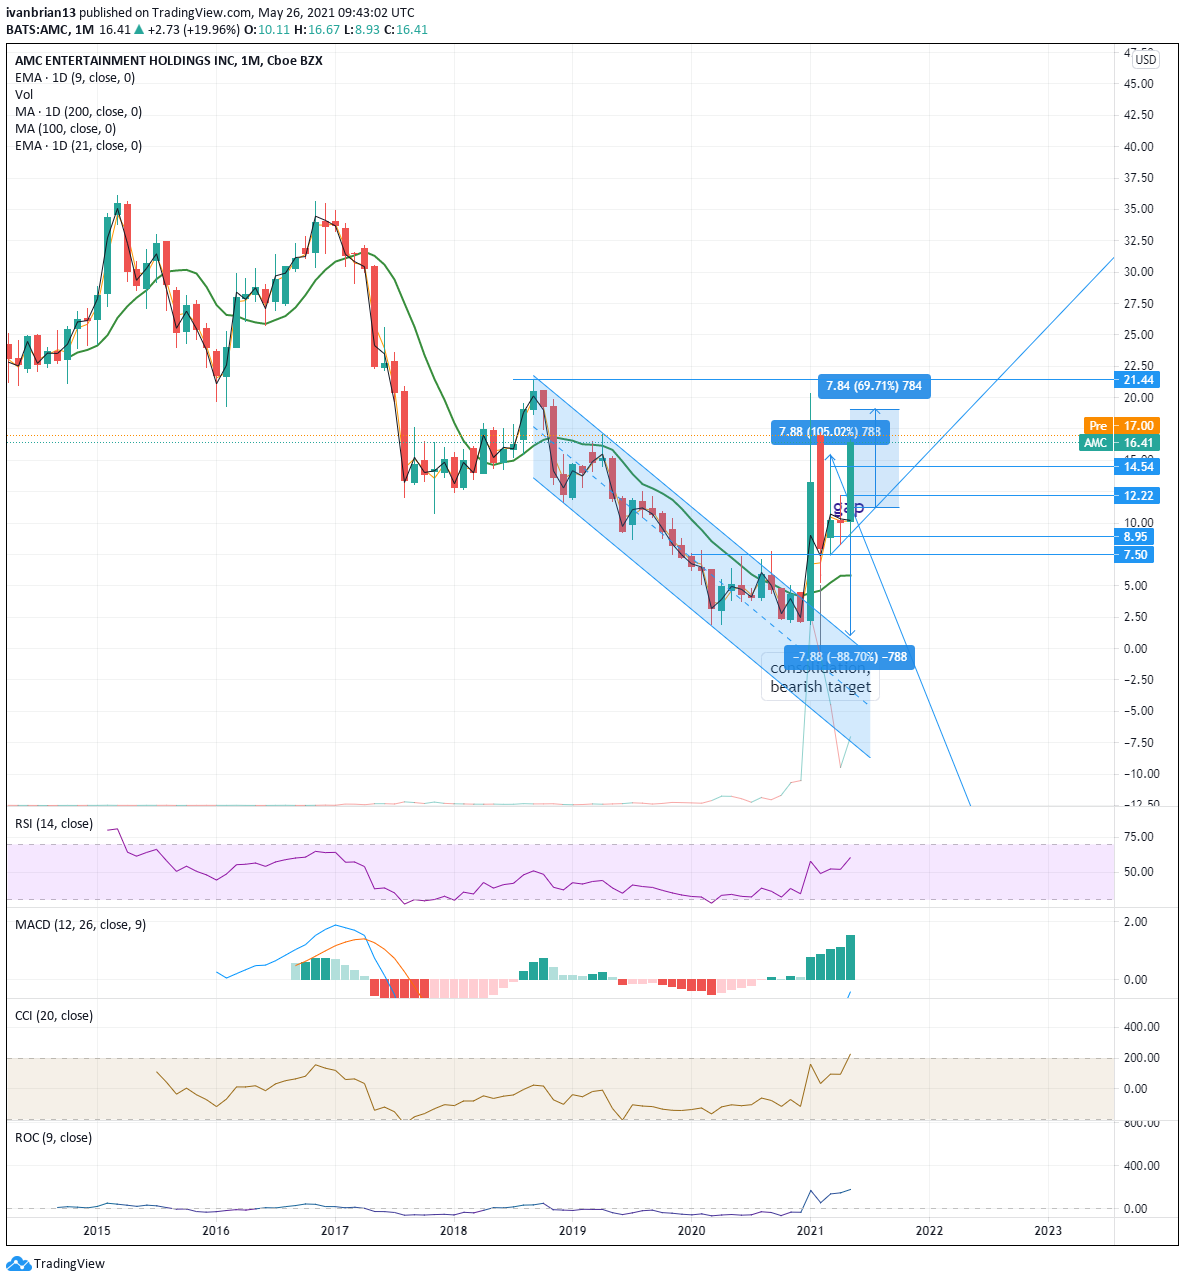
The monthly chart gives a much nicer view of the breakout and how well AMC shares have traded from a technical perspective. The breakout in January was confirmed with a surge in volume and an almost perfect retracement and retesting of the $7.50 breakthrough level. The monthly chart also shows the nice base around $2.50 that AMC had formed and defended multiple times.
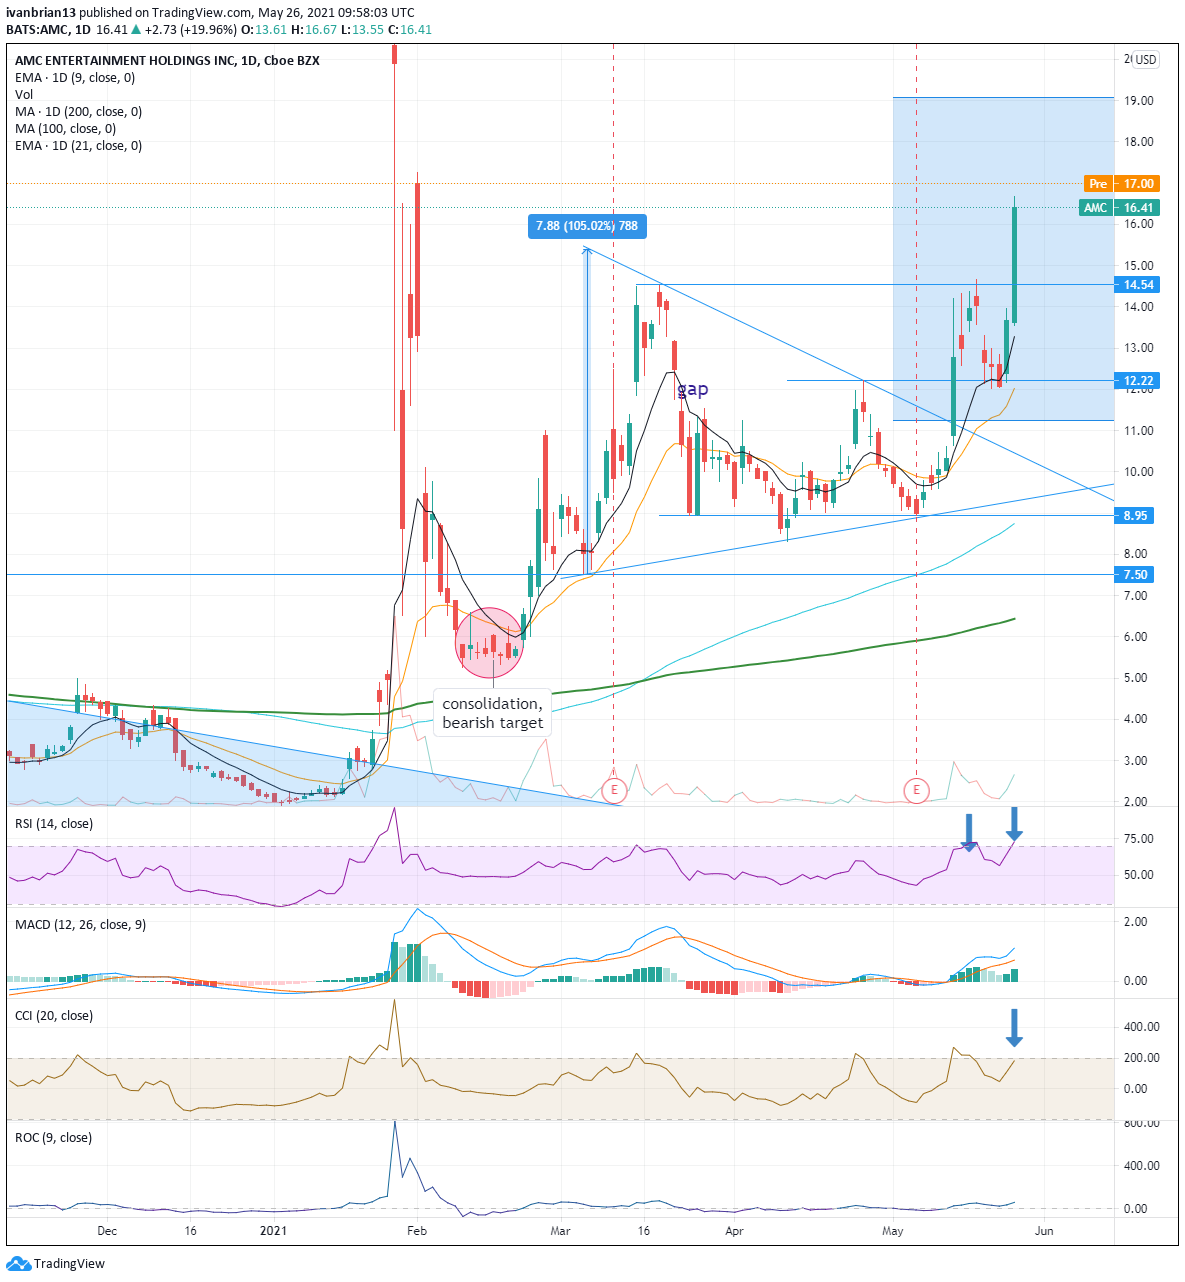
The short-term daily chart gives us a bit more detail on the move and the key levels to watch next. Taking out $14.54 was an extremely bullish move and sets up some intermediate resistance at $17.25, the high from Feb 1. Above this is a test of the wallstreetbets high of $20.36 and we then have to go back to the high from September 2018 at $21.44 for the next resistance level. Now that $14.54 has broken it becomes a key support and would like to hold to keep the bullish sentiment in place. This is clearly the dominant theme and the 9-day moving average has been signalling this perfectly. Some alarm bells are flashing again though at the speed of the move. AMC is no slouch and does not like to move slowly. But that does mean the momentum oscillators often show overstretched levels. The Relative Strength Index (RSI) is in overbought territory and the Commodity Channel Index (CCI) is just close to overbought. The last time this occurred was on the May 13 explosion and it did lead to a gradual retracement of prices, so this needs to be watched closely. It is not saying the party and push for the moon is over but just that a retracement or consolidation is more likely. So long as AMC holds $8.95 it is still in a longer term bullish trend of higher lows and higher highs. Shorter term $12.22 is the key to remainig in abullish formation.
| Support | 14.54 | 12.22 | 9.40 trendline | 8.95 | 6.44 200-day |
| Resistance | 17.25 | 20.36 | 21.44 |