USD/INR Price News: Indian rupee sellers tease falling wedge breakout to target 73.00.
- USD/INR struggles to confirm the bullish chart formation.
- MACD, RSI back recovery moves but nearby SMA probe the buyers.
- Sellers look for clear break below 72.60 for fresh entry.
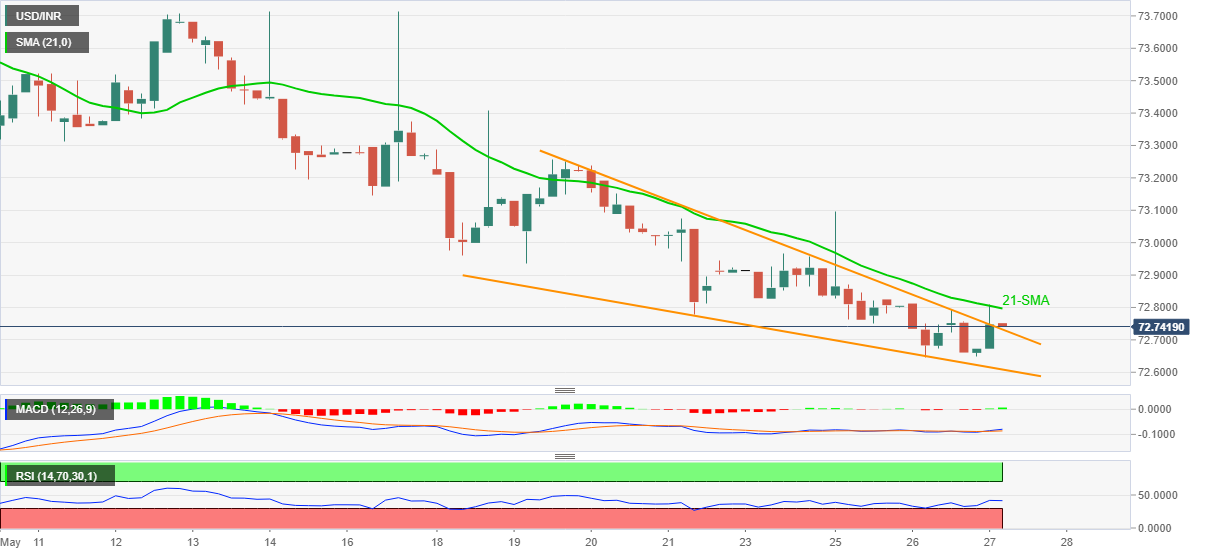
USD/INR battles key hurdle to the north around 72.75-80, up 0.13% intraday, amid the initial hour Thursday’s of Indian trading session. In doing so, the Indian rupee (INR) pair snaps a five-day downtrend while looking to confirm a bullish chart pattern, falling wedge, on the four-hour (4H) play.
Given the recent improvement in the MACD signals and RSI recovery, USD/INR is likely to keep the corrective pullback. However, a clear break of 21-SMA level near 72.80 becomes necessary for the bull's return.
Following that, the 73.00 round-figure and the weekly top surrounding 73.25 can offer intermediate halts during the run-up to the theoretical target near 73.40.
Alternatively, pullback moves should defy the bullish chart formation, via a downside break of the wedge’s support near 72.60, to recall the USD/INR sellers.
In that case, 72.50 and 72.30 could return to the chart ahead of directing the bears to attack the yearly bottom of 72.17.
Overall, USD/INR bears seem tiring and hence the much-awaited corrective pullback appealing.
USD/INR four-hour chart
Trend: Further recovery expected