NZD/USD Price Analysis: Lacks follow through inside falling wedge after China CPI, PPI
- NZD/USD fades rebound from intraday low inside a bullish chart pattern.
- China’s CPI eased, PPI jumped the most since 2008 in May.
- 200-HMA offers extra hurdle to the north, weekly support line also probes sellers.
- MACD conditions strengthen bullish bias but confirmation becomes necessary.
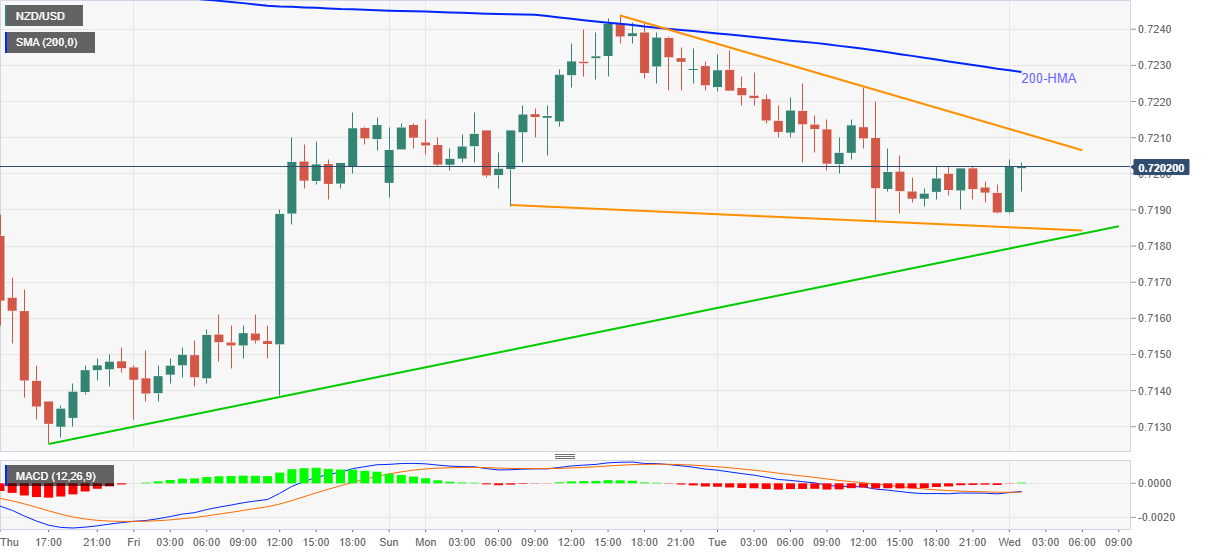
NZD/USD struggles to keep the latest recovery moves around 0.7200, marking no change on a day, during the early Wednesday. In doing so, the Kiwi pair portrays the market’s confusion over China’s latest inflation figures.
While the headlines Consumer Price Index (CPI) slipped below 1.6% YoY forecast to 1.3%, a jump in the Producer Price Index (PPI) to 9.0%, versus 8.5% expected, couldn’t please the market bulls.
Even so, a gradually firming MACD histogram and falling wedge bullish formation on the hourly chart keeps NZD/USD buyers hopeful.
The run-up needs confirmation from the 0.7211 hurdle before challenging the 200-HMA near 0.7230, a break of which will escalate the north-run towards the theoretical target of 0.7270 and then to the 0.7300 round-figure.
Alternatively, pullback moves will highlight the wedge’s support line near 0.7185 and an ascending trend line from last Thursday, close to 0.7180.
NZD/USD hourly chart
Trend: Recovery expected