Gold Price Forecast: XAU/USD approaches key $1790 resistance ahead of NFP – Confluence Detector
- Gold heads towards $1800 as markets remain cautiously optimistic.
- Gold awaits NFP to confirm the bullish reversal despite Fed’s hawkish turn.
- Gold Weekly Forecast: Sellers look to retain control following uninspiring rebound
Gold price is advancing for the third straight day on the final trading day of this week, with all eyes on the much-awaited US NFP data release to confirm the bullish reversal from two-month troughs of $1751. The recovery in gold price is gaining traction despite the persistent strength in the US dollar against its main peers. The Fed’s willingness to resort to monetary policy normalization has emerged as the main driver behind the greenback’s surge. However, the US Treasury yields are on a losing spree, which has fuelled gold’s advance. Delta covid strain flareups have raised concerns over its impact on the global economic recovery, boosting gold at the expense of the risk-sensitive assets.
Gold’s fate now hinges on the US NFP data, which is likely to throw fresh hints on the Fed’s next policy move. However, if the data disappoints just like the last time, gold price is likely to recapture $1800 while the dollar reverses recent gains.
Read: NFP Preview: Four reasons why June's jobs report could be a dollar downer
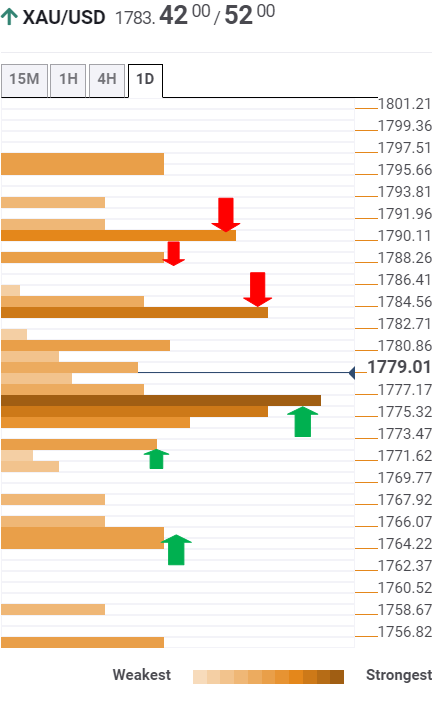
Gold Price: Key levels to watch
The Technical Confluences Detector shows that gold price is fast approaching the previous day’s high at $1783, above which the bulls will test powerful resistance around $1790.
At the level, the SMA100 one-day, Fibonacci 23.6% one-month and Fibonacci 23.6% one-week coincide.
The confluence of the previous week’s high and the pivot point one-week R at $1796 will be a tough nut to crack for the gold buyers.
Meanwhile, the upside momentum will remain intact so long as gold price holds $1776, which comprises a dense cluster of healthy support levels – SMA10 one-day, Fibonacci 61.8% one-week and SMA200 one-hour.
A breach of the last would expose the Fibonacci 61.8% one-day at $1772.
Further south, the intersection of the previous day’s low and pivot point one-day S1 at $1767 could likely guard the downside.
Here is how it looks on the tool
About Technical Confluences Detector
The TCD (Technical Confluences Detector) is a tool to locate and point out those price levels where there is a congestion of indicators, moving averages, Fibonacci levels, Pivot Points, etc. If you are a short-term trader, you will find entry points for counter-trend strategies and hunt a few points at a time. If you are a medium-to-long-term trader, this tool will allow you to know in advance the price levels where a medium-to-long-term trend may stop and rest, where to unwind positions, or where to increase your position size.