
GBP/USD Price Analysis: Seesaws above 1.3800 inside monthly falling wedge
- GBP/USD struggles to extend Friday’s recovery moves, stays inside bullish chart formation.
- Momentum pullback teases the buyers, further losses envisioned.
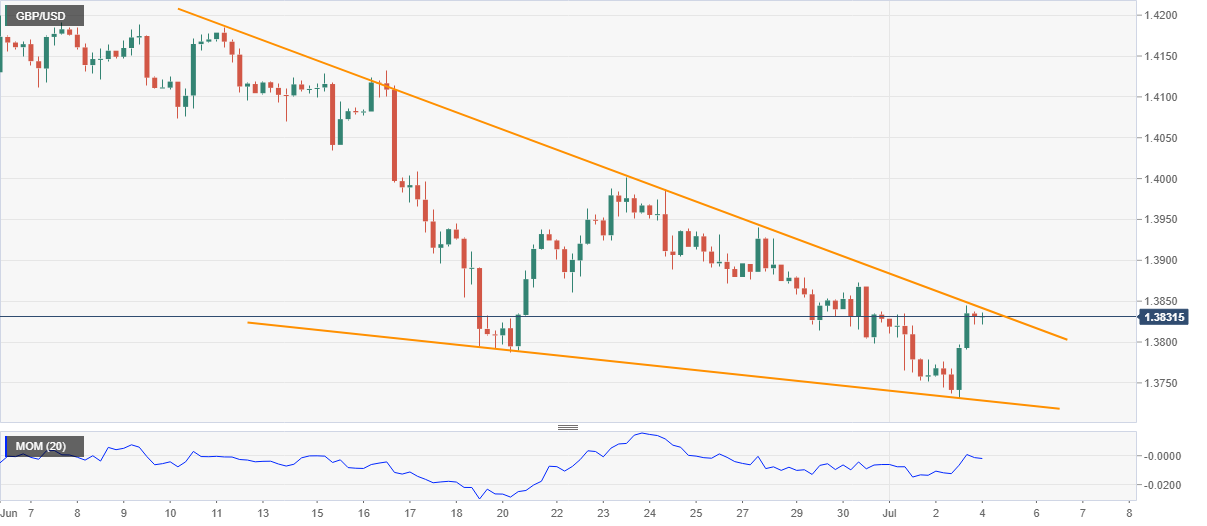
GBP/USD buyers flirt with short-term key resistance line after Friday’s recovery from mid-April lows. In doing so, the cable pair seesaws around 1.3830 inside a falling wedge bullish chart pattern on the daily play.
Given the sluggish Momentum line and the pair’s failures to extend the bounce off multi-day low, the quote may witness a pullback towards the 1.3800 round figure.
Though, any further downside will be tested by the stated bullish formation’s support line, around 1.3730. During the fall, June’s low around 1.3785 may act as an intermediate halt.
It’s worth noting that the pair’s declines past 1.3730 will be challenged by lows marked during March and April surrounding 1.3670.
Alternatively, an upside break of the 1.3845 resistance line will confirm the bullish chart pattern with an initial rise targeting late June’s top of the 1.4000 threshold.
However, GBP/USD upside beyond the 1.4000 round figure will be questioned by early June lows near 1.4080, a break of which could propel the quote to the 1.4240-50 area comprising the yearly highs, also the highest since April 2018.
GBP/USD: Four-hour chart
Trend: Pullback expected