GBP/USD Price Analysis: Attempts a bounce from a critical daily support line
- GBP/USD bounces-off key support near 1.3730, not out of the woods yet.
- Daily closing above 200-DMA could offer temporary respite to GBP bulls.
- RSI remains in the bearish zone, keeping the downside risks intact.
GBP/USD is struggling to extend its bounce above 1.3750, having hit monthly lows at 1.3726 on Tuesday.
The cable is currently trading at 1.3756, up 0.13% on the day, having rebounded from a critical upward-sloping daily support line at 1.3730. The line connects the previous day’s low and July lows.
In doing so, the pair has stalled its two-day decline, although the risks remain skewed to the downside following a daily closing below the 200- Daily Moving Average (DMA) at 1.3768.
Further, the 14-day Relative Strength Index (RSI) edges higher but remains below the midline, keeping the sellers hopeful.
Adding credence to an impending downside breakout, the 50-DMA is fast approaching the 21-DMA, with a break lower to confirm a bear cross – a bearish technical signal.
A daily closing below the abovementioned key support could trigger a fresh sell-off towards the 1.3700 round number.
Sellers will then aim for the July lows at 1.3672 should the downside pressure accelerate.
GBP/USD: Daily chart
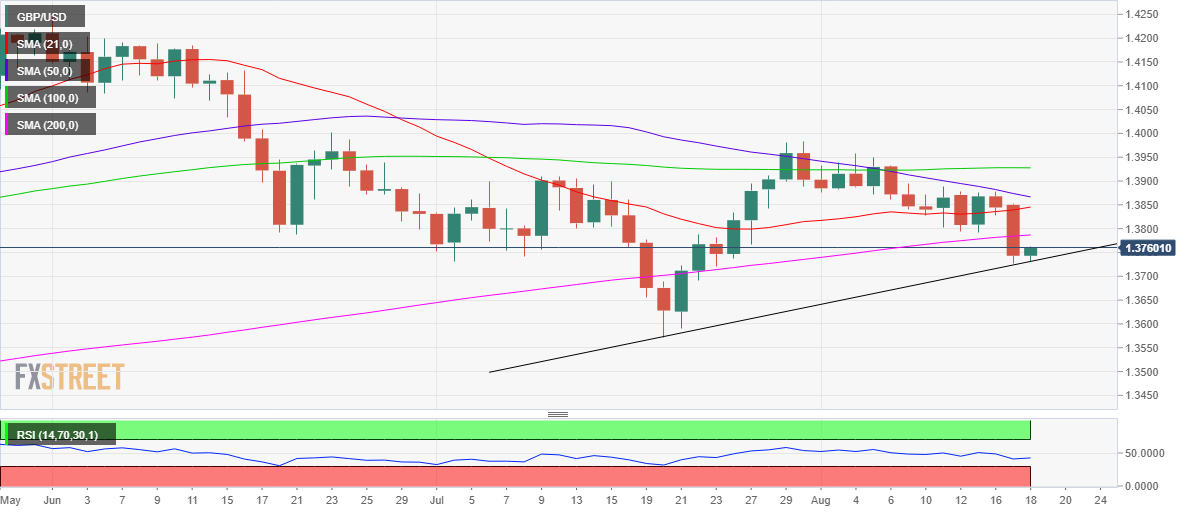
Alternatively, a firm break above the 200-DMA is needed for a temporary respite to the cable buyers.
The horizontal 21-DMA at 1.3845 could challenge the bullish commitments on the road to recovery.
GBP/USD: Additional levels to consider