NZD/USD Price Analysis: Refreshes 2021 low as bears attack 0.6860 key support
- NZD/USD drops to the fresh low since November 2020, prints four-day downtrend.
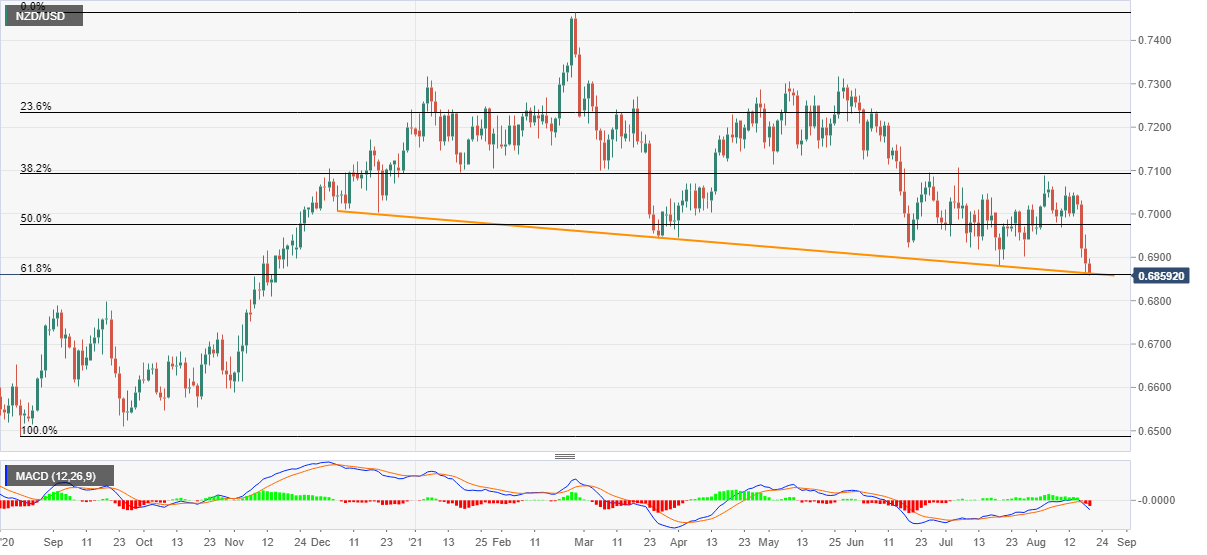
- Bearish MACD, downside break of July’s low favor sellers.
- Convergence of yearly support line, 61.8% Fibonacci retracement level challenge immediate downside.
NZD/USD takes offers around 0.6860, the lowest levels since November 2020, during Thursday’s Asian session. That said, the kiwi pair prints 0.35% intraday loss while printing a four-day downtrend by the press time.
In doing so, the pair sellers attack a confluence of a downward sloping trend line from December 2020 and a 61.8% Fibonacci retracement of August 2020 to February 2021 upside.
It should be noted, however, that the bearish MACD signals and the pair’s sustained trading below July’s low keep the NZD/USD sellers hopeful.
Hence, a clear downside break of 0.6860 becomes necessary for the pair bears to aim for mid-November 2020 bottom of 0.6810 and September 2020 peak close to 0.6800.
However, any further weakness past 0.6800 will not hesitate to challenge October 2020 top near 0.6725.
Alternatively, a daily closing beyond July’s low of 0.6880 will trigger a corrective pullback towards June’s trough near 0.6925 and the early 2021 lows near 0.6945.
Though, a 50% Fibonacci retracement level close to 0.6975 challenges the NZD/USD run-up beyond 0.6945.
NZD/USD: Daily chart
Trend: Further weakness expected