Gold Price Forecast: XAU/USD faces a wall of resistances on its way to $1800 – Confluence Detector
- Gold price rebounds from the Fed minutes-led sell-off to $1775.
- Risk-off mood weighs heavily on US yields, which drag the dollar lower.
- Gold Price Forecast: Downside potential for XAU/USD seems limited amid COVID-19 woes.
The risk-off market profile has once again come to the rescue of gold price, as it makes a tepid recovery attempt towards the $1800 mark. Coronavirus resurgence-induced economic growth concerns have spooked markets, boosting haven flows into US bonds, gold at the expense of the stocks and yields. The sell-off in the US Treasury yields capped the gains in the US dollar, prompting the rebound in gold price from four-day lows of $1775.
Gold price slid earlier on the day after the FOMC minutes raised the Fed’s tapering speculation. The Fed minutes indicated a willingness to start reducing asset purchases before the end of the year.
Read: Fed minutes underwhelm, as investor caution grows
Gold Price: Key levels to watch
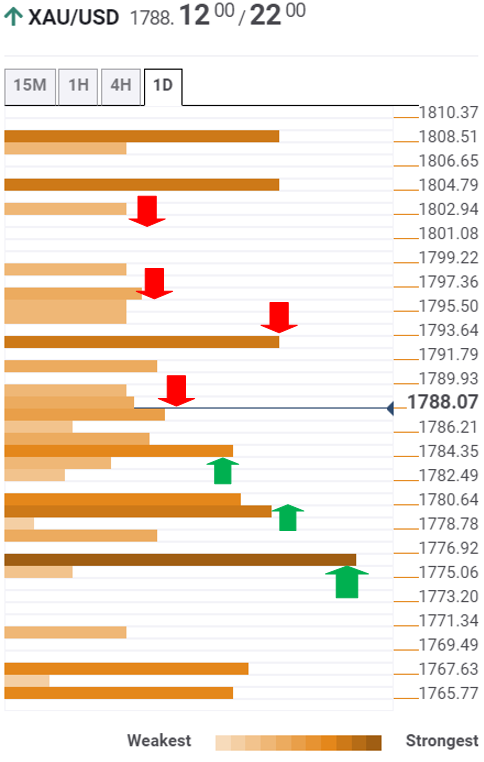
The Technical Confluences Detector shows that gold is testing a dense cluster of healthy resistance levels around $1788, which is the convergence of the Fibonacci 38.2% one-day, SMA50 one-hour and Bollinger Band one-day Middle.
If the abovementioned demand zone is cleared, then the bulls will challenge the Fibonacci 23.6% one-day at $1790.
Acceptance above the 61.8% one-month at $1793 is needed to encourage bullish traders.
The next crucial upside barrier is seen near $1796, where the pivot point one-day R1 coincides with the SMA200 four hour.
Further up, the $1800 threshold will come into play.
On the flip side, the Fibonacci 61.8% one-day at $1784 is the immediate cap, below which $1780 will emerge as fierce support.
That level is the confluence of the previous week’s high, SMA5 one-day and the pivot point one-day S1.
The intersection of the pivot point one-month S1 and the previous low four-hour at $1775 will test the bearish commitments should the downside resume.
Here is how it looks on the tool
About Technical Confluences Detector
The TCD (Technical Confluences Detector) is a tool to locate and point out those price levels where there is a congestion of indicators, moving averages, Fibonacci levels, Pivot Points, etc. If you are a short-term trader, you will find entry points for counter-trend strategies and hunt a few points at a time. If you are a medium-to-long-term trader, this tool will allow you to know in advance the price levels where a medium-to-long-term trend may stop and rest, where to unwind positions, or where to increase your position size.