US Dollar Index Price Analysis: DXY bears attack key support below 93.00
- DXY fades bounce off ascending trend line from early June.
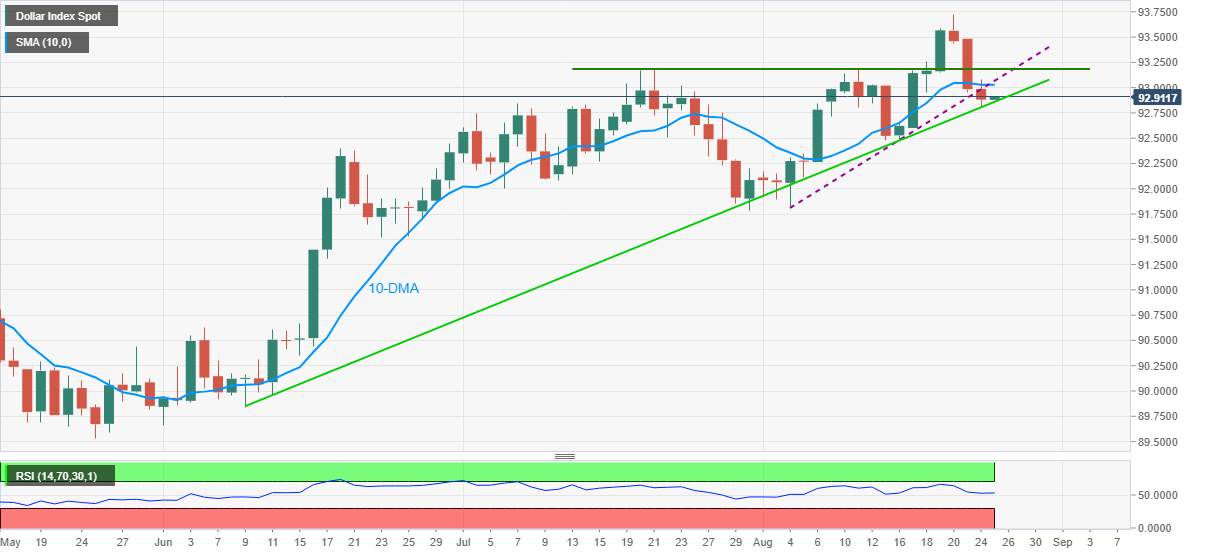
- Sustained break of 10-DMA, monthly rising support line join steady RSI to back the bears.
- Bulls need to overcome 93.20 hurdle to regain controls.
US Dollar Index (DXY) remains on the back foot around 92.89, down for the third consecutive day, during early Wednesday.
In doing so, the greenback gauge battles a nearly three-month-old rising support line amid steady RSI. It’s worth noting that the quote’s downside break of 10-DMA and an upward sloping trend line from August 04, marked the previous day, keep sellers hopeful.
Hence, a clear downside break of 92.80 becomes necessary for the DXY bears to tighten the grips.
Following that, the mid-August lows and the monthly bottom, respectively around 92.48 and 91.80, will be in focus.
On the flip side, a corrective pullback beyond the 93.00–05 area comprising the previous support line and 10-DMA should renew buying.
However, the double-top formation around 93.20 and the 93.50 hurdle could challenge the US Dollar Index bulls afterward.
DXY: Daily chart
Trend: Further weakness expected