Gold Price Forecast: XAU/USD needs to crack $1820 to revive the uptrend – Confluence Detector
- Gold price turns south once again, with eyes on Friday’s NFP.
- The US dollar rebounds but not out of the woods yet.
- Gold could target $1,830 next ahead of NFP.
Gold price continues to enjoy good two-way price movements while holding at the higher end of this week’s trading range. Its appears that the bright metal is biding time heading into Friday’s crucial US labor market report, which is eagerly awaited after a big miss on the ADP private sector survey. Persisting Delta covid variant concerns, fading Fed’s tapering bets and expectations of more stimulus from China are helping gold price to stay afloat well above the $1800 mark.
Read: Gold Price Forecast: Shine on you crazy diamond
Gold Price: Key levels to watch
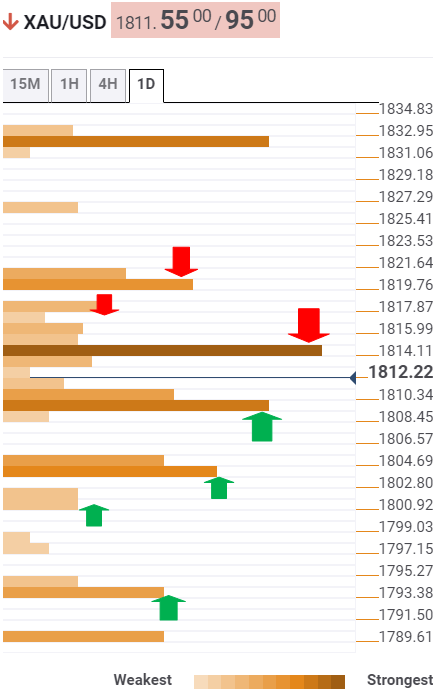
The Technical Confluences Detector shows that gold price is testing bullish commitments at fierce support around $1810, which is the confluence of the SMA200 one-day, the previous day’s low and Fibonacci 23.6% one-week.
If the latter gives way, then the sellers will target the demand area around $1803, where the Fibonacci 38.2% one-week, pivot point one-day S2 and SMA50 four-hour converge.
The next support is seen at the Fibonacci 161.8% one-day at $1800. At that point, the SMA10 one-day aligns.
A sustained break below that support could trigger a steep drop towards the intersection of the SMA200 four-hour and Fibonacci 61.8% one-week at $1793.
On the flip side, gold bulls need to find a strong foothold above 1815, the confluence of the SMA50 one-hour, Fibonacci 38.2% one-day and Bollinger Band four-hour Middle.
Up next, the Fibonacci 23.6% one-day at $1817 will threaten the upside attempts.
Gold buyers could then eye a sustained move above powerful resistance at $1820. That level is the meeting point of the pivot point one-day R1, the previous week’s high and the previous day’s high.
Here is how it looks on the tool
About Technical Confluences Detector
The TCD (Technical Confluences Detector) is a tool to locate and point out those price levels where there is a congestion of indicators, moving averages, Fibonacci levels, Pivot Points, etc. If you are a short-term trader, you will find entry points for counter-trend strategies and hunt a few points at a time. If you are a medium-to-long-term trader, this tool will allow you to know in advance the price levels where a medium-to-long-term trend may stop and rest, where to unwind positions, or where to increase your position size.