US Dollar Index Price Analysis: Renews multi-day low, inches closer to 10-week-old support
- DXY drops to fresh low since August 05 during a four-day downtrend.
- Descending RSI line, 50-DMA direct sellers toward the key support line.
- Two-week-old resistance line adds to the upside filters.
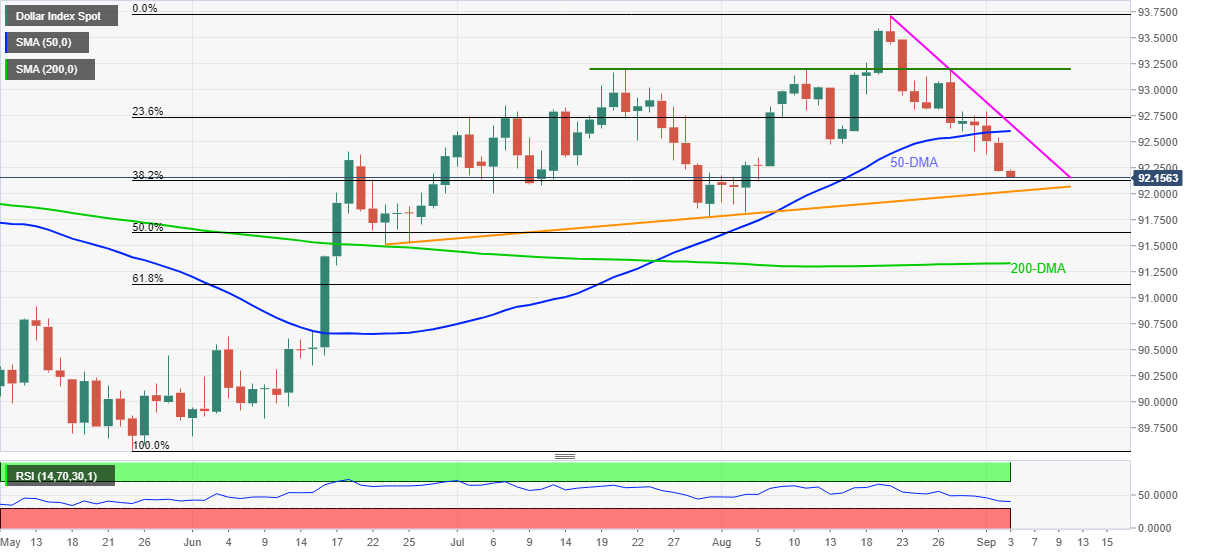
US Dollar Index (DXY) drops for the fourth consecutive day to refresh one-month low around 92.16, down 0.06% intraday, during early Friday.
In doing so, the greenback gauge justifies the downside break of 50-DMA as well as descending RSI line, not oversold.
With this, the DXY declines towards an ascending support line from June 23, near the 92.00 threshold.
It should be noted, however, that 50% Fibonacci retracement of May-August upside and late June’s swing low, respectively around 91.62 and 91.50, will offer intermediate halts to the fall targeting the 200-DMA level of 91.33.
Meanwhile, corrective pullback needs to cross the 50-DMA level of 92.60 to recall the buyers.
Even so, a downward sloping trend line from August 20, near 92.70, adds to the upside filters before directing DXY bulls to a horizontal area comprising multiple tops marked since July 21, around 93.20.
DXY: Daily chart
Trend: Further weakness expected