US Dollar Index Price Analysis: Inverse H&S on 4H keeps DXY bulls hopeful
- US Dollar Index battles key hurdle to confirm the bullish chart pattern, picks up bids of late.
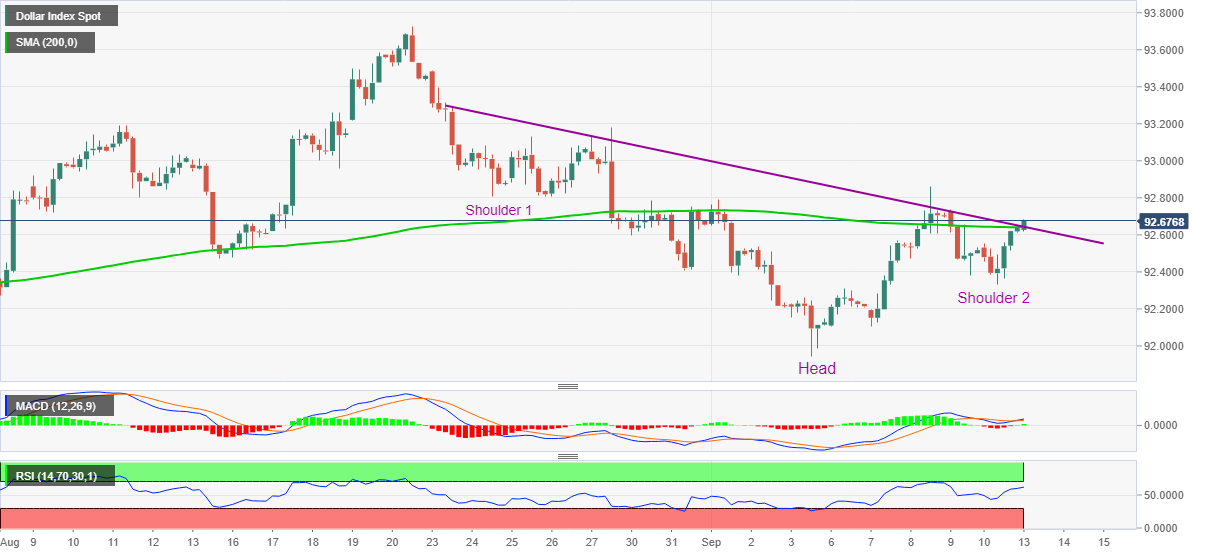
- Firmer RSI, bullish MACD favor buyers, 200-SMA adds strength to the resistance level.
US Dollar Index (DXY) pieces the key resistance around 92.65, up 0.05% intraday during early Monday. In doing so, the greenback gauge battles 200-SMA and the neckline of a head-and-shoulders (H&S) chart pattern on the four-hour (4H) play.
Given the upbeat RSI line and recently bullish MACD signals join the bullish chart formation, the quote is likely positive. However, 200-SMA also strengthens the resistance level near 92.65-70.
Hence, a clear upside break of 92.70 will be a strong boost to the DXY bulls targeting the August month’s high, also the yearly peak, near 93.72.
During the expected run-up, the 93.00 threshold and late August peak near 93.15 may act as buffers.
On the contrary, pullback moves may aim for 92.40 but the 92.00 threshold and the monthly low near 91.95 challenges the US Dollar Index bears afterward.
Overall, DXY is up for a notable rise but bulls need confirmation.
DXY: Four-hour chart
Trend: Further upside expected