Silver Price Analysis: XAG/USD extends break of 100-SMA to refresh monthly low
- Silver bounces off intraday low but holds lower ground.
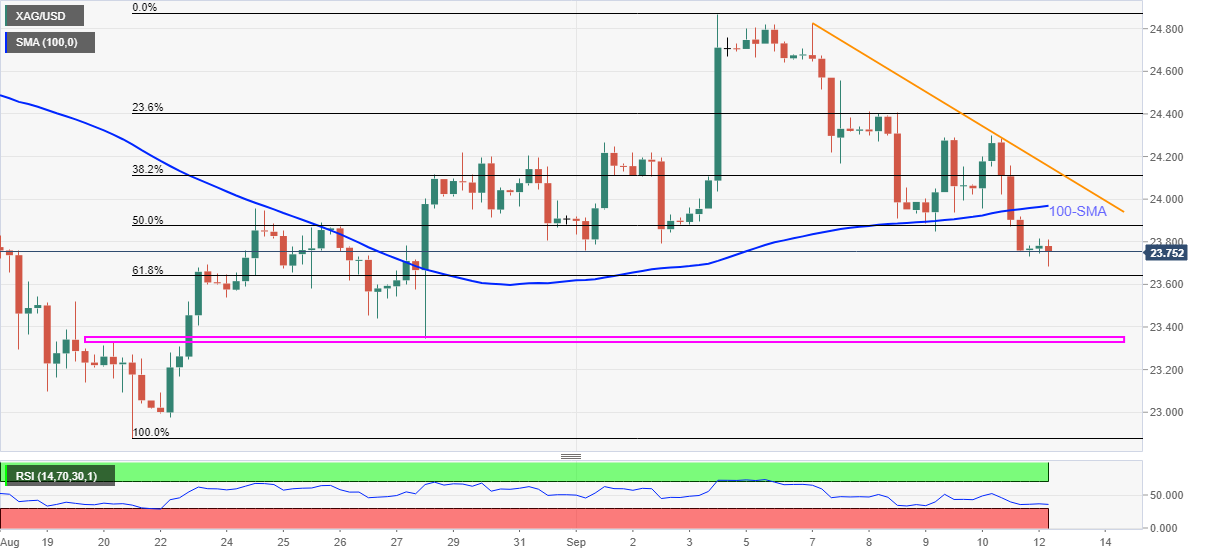
- Nearly oversold RSI conditions suggest corrective pullback but sustained break of 100-SMA, weekly resistance line back bears.
Silver (XAG/USD) drops to the lowest since August 27, recently sidelined around $23.77 during early Monday.
In doing so, the bright metal justifies the downside break of 100-SMA and a one-week-old falling trend line. However, nearly oversold RSI challenges the sellers.
Hence, silver remains bearish unless crossing the 100-SMA level of $24.00, as well as the stated resistance line near $24.15.
In a case where the XAG/USD buyers cross $24.15, the monthly high of $24.86 will be on the radar before the %25.00 threshold.
Meanwhile, 61.8% Fibonacci retracement level of August 20 to September 03 upside near $23.60 offers immediate support.
Should silver bears keep reins past $23.60, a horizontal area from August 20, near $23.35-30 will restrict the quote’s south-run before August 20 low of $22.87 and the yearly bottom surrounding $21.15.
Silver: Four-hour chart
Trend: Further weakness expected